


CPI only moves through CPM, CTR and CVR. Decompose the change, localize it by OS, geo, network and campaign, then fix the leg that actually broke.
Oct 15, 2026 - 15 minutes

Your CPI went up 18% this week. Before you cut bids, pause a campaign or blame the algorithm, answer one question: which leg moved? Cost per install can only rise through three channels — you paid more per thousand impressions (CPM), fewer people clicked (CTR), or fewer clickers installed (CVR). Each points to a different cause and a different fix. If your CPI is increasing and you act before decomposing it, you have roughly a two-in-three chance of fixing the wrong thing.
CPI increases when CPM rises, CTR falls, CVR falls, or spend shifts toward segments that are structurally more expensive. Decompose the change into those legs, find which one moved and when, then localize it to the OS, country, network or campaign where it lives. A move at the account level is a symptom; the cause almost always lives in a slice.
One more thing before you panic: a higher CPI is not automatically bad. If you are buying more relevant users who retain and pay better, a higher CPI can lift ROAS. Cheap installs can be bad installs. Always read the CPI move next to D1 retention and early ROAS of the same cohorts.
CPI = CPM ÷ (CTR × CVR) ÷ 1,000
where CPM = spend ÷ impressions × 1,000, CTR = clicks ÷ impressions, and CVR = installs ÷ clicks (click-to-install). Because CTR and CVR divide, their effects compound: a 10% drop in both raises CPI by 23.5%, not 20%. The full derivation and sensitivity math are in our CPI formula explainer.
- CPM = spend ÷ impressions × 1,000. It moves with auction pressure, seasonal demand, pricier inventory, your own frequency saturation, or a raised bid or target.
- CTR = clicks ÷ impressions. It moves with creative fatigue, audience exhaustion, or a hook that stopped working.
- CVR = installs ÷ clicks. It moves with a store page change, click quality, or a mismatch between the ad and the store listing.
- Mix = Σ (segment share × segment CPI). It moves when budget shifts toward structurally pricier OS, geos or networks.
From the PvX Delta audit spec's sample results. The account is fictional and the numbers are illustrative.
Aggregate CPI, 7-day average, is $4.10 against a prior-28-day baseline of $3.47: +18%, six consecutive days above the normal band. Decomposed:
- CPM +8.0%
- CTR −5.6%
- CVR −3.2%
Check: 1.080 ÷ (0.944 × 0.968) = 1.182, so the legs account for the full +18%. To say how much each contributed, use logs (they add where percentages don't): ln(1.080) = 0.077, −ln(0.944) = 0.058, −ln(0.968) = 0.033.

Nearly half the move is CPM. That is where to start. Illustrative data.
Localizing each leg told three separate stories:
- CPM: one ad network's CPM jumped 31% starting the day it pushed a bidder update. Separately, Korea's CPM rose 22% on both Meta and TikTok at once — a market-wide competitor launch, not an account problem.
- CTR: creative fatigue on Meta, already flagged by the creative pass.
- CVR: the entire CVR dip started the day a store-listing screenshot test went live.
Two further checks made it a real threat rather than an artifact. First, rate, not mix: holding segment spend weights fixed, CPI was still +16%, so it wasn't just budget drifting toward pricier segments. Second, quality: D1 retention of the pricier cohorts was flat at about 39%. The account was paying more for the same users, so ROAS took the full hit.
The action followed the biggest leg. Bid the inflated network down about 15% and move $250 a day to a cheaper tier-2 source. Hold Korea bids rather than chase market inflation. Let the creative refresh already queued for the CTR leg run its course.
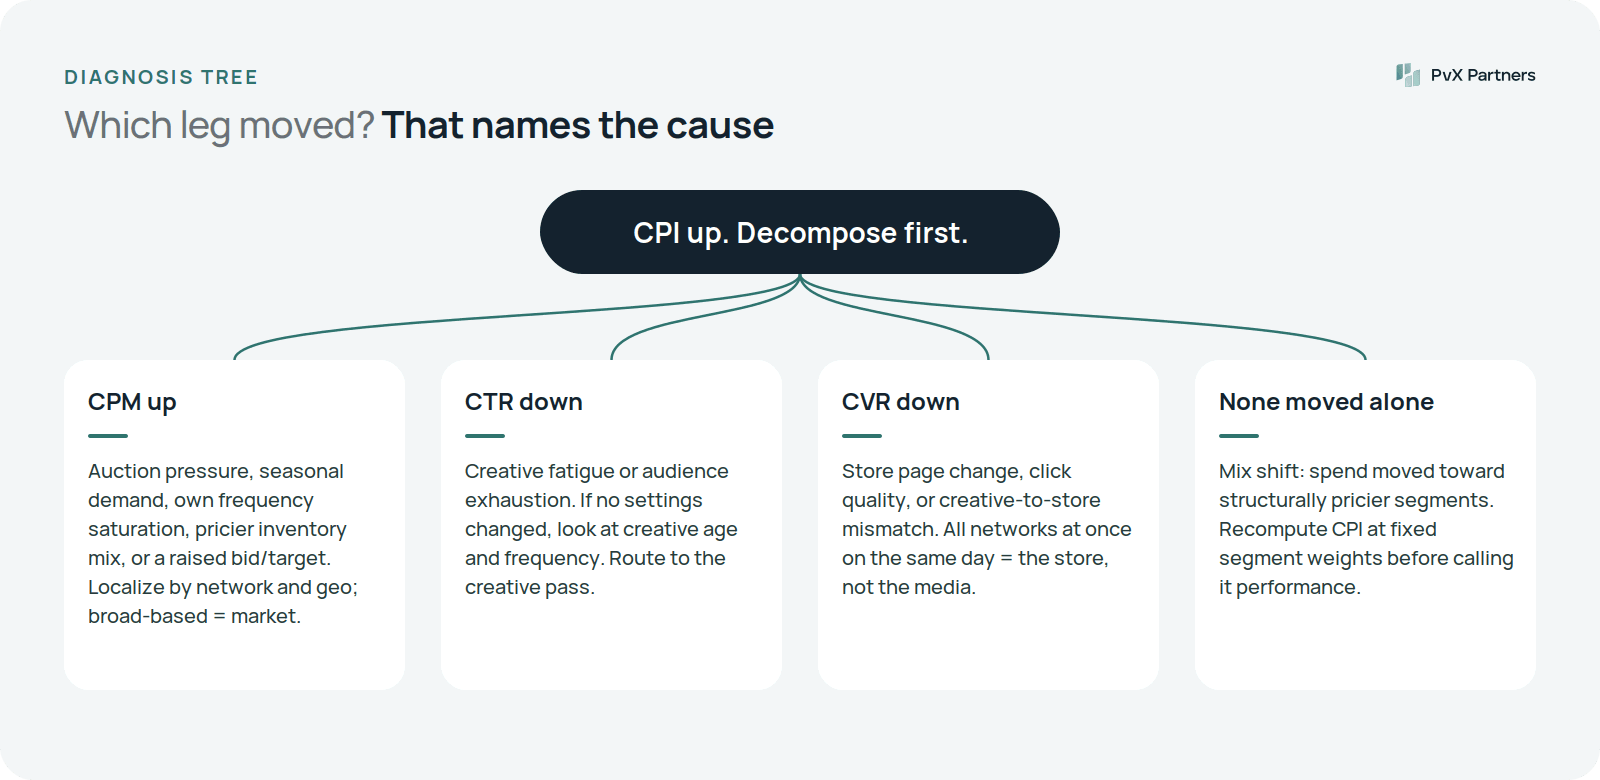
Ask whether the move is broad or local. If every network and every geo moved at once, it's market pressure — seasonality, a big advertiser entering, a holiday auction. You can't fix the market; you can decide whether marginal installs still pay back at the new price. If one network or one country moved, look for what changed there: a bidder update, a placement mix shift toward premium video, a narrowed audience, or your own frequency climbing as you re-buy the same people.
If no settings changed (targeting, optimization event, placements), a CTR decline is almost always creative. Check the spend-weighted age of your top creatives and their CTR against their own peaks. In another of the spec's samples, a Meta CPI rise of 14% was entirely the CTR leg: two hooks aged 52 and 47 days were carrying 71% of Meta spend. Fix the creative and leave the bids alone.
A CVR break that hits every network on the same day is the store, not the media: a new screenshot set, a price change, a rating drop, a store experiment. In one spec sample, Japan's CPI rose 13% entirely through CVR (24.0% → 20.9%). A seasonal-event store update had shipped English-only screenshots to the Japanese store; Germany showed the same signature. A CVR drop on one network only points at click quality or an ad-to-store mismatch.
If each segment's CPI is flat but the blended number rose, spend moved toward pricier segments — more iOS, more tier-1 geos, more of a premium network. That's an allocation story, not a performance story. Recompute CPI at fixed segment weights before you call it a problem.
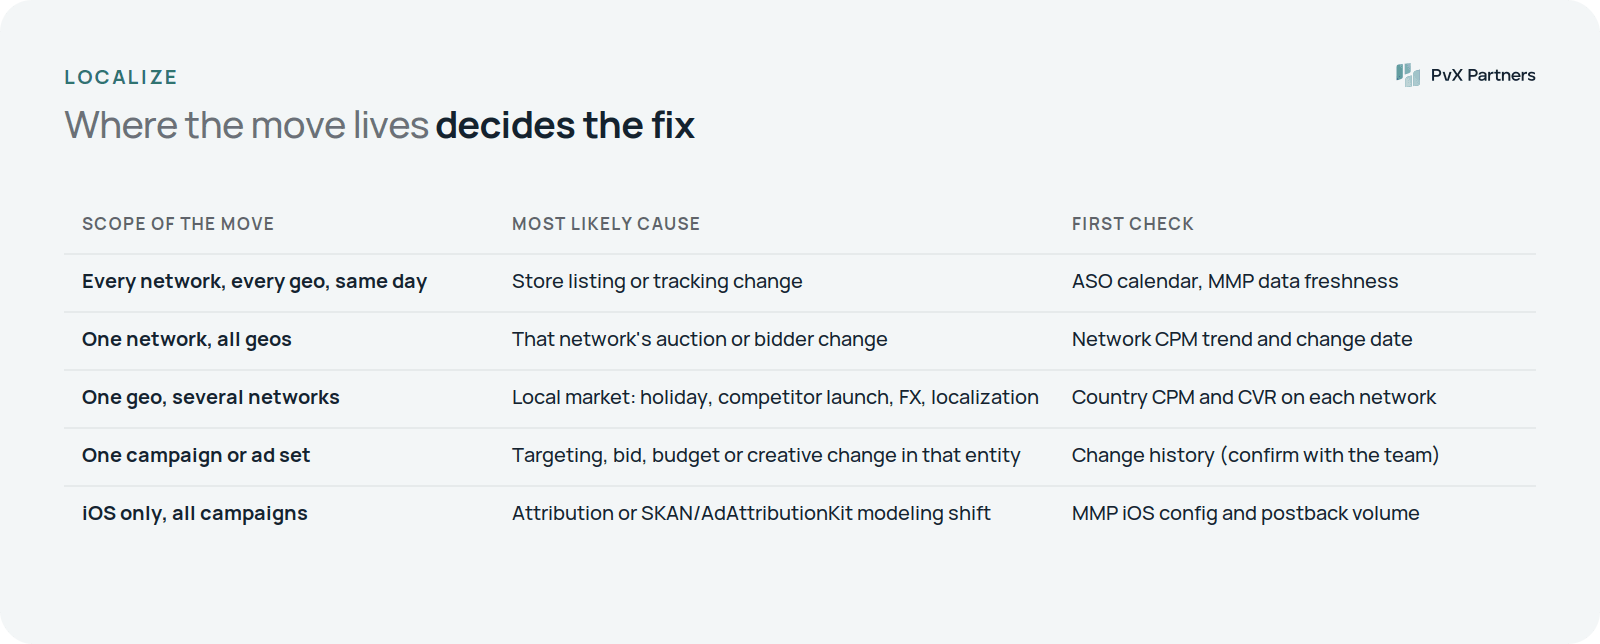
iOS and Android run different auctions and different attribution. Judge each against its own history. An iOS-only CPI jump across every campaign on the same date deserves a look at the SKAN/AdAttributionKit setup and install counts before you touch bids.
A single top-five market's move is material on its own. Countries carry their own holidays, sales events, FX effects and localization problems. Pool the long tail of smaller countries into one rest-of-world cluster so its noise doesn't flood the diagnosis.
Compare each network's CPI legs to its own baseline. A move on every network is the market or your store; a move on one network is that network.
Within a network, find the campaigns carrying the move. A campaign-level CPI jump right after a budget increase is often mechanical: scaling faster than the audience absorbs raises CPI. Budget, bid or targeting change history is the first thing to check. If your tools don't log it, ask the person who made the change.
If campaign names encode audience type, compare CPI by audience across the account. Small lookalikes saturate and inflate first.
- Noise. Is the move new or persistent over 30 days, and beyond this metric's normal variance? Six days above the band is a signal; one expensive Tuesday is not.
- Thin segments. A CPI spike on a slice with 800 installs a month is unreadable at daily grain. Apply a volume and spend floor first.
- Mix shift. See above: check rate versus mix.
- Seasonality. Q4 CPM inflation is real and recurs every year. Compare against the same period last year where you have it.
- A deliberate change. A new optimization event or a higher tCPI target raises CPI by design. Re-baseline from the change date.
- Attribution. If installs dropped on the MMP side but not the network side, CPI "rose" because of measurement. Cross-check MMP and network installs.
- CPM up in one network or geo, ROAS falling: rebid down or shift budget to cheaper segments that still clear your ROAS target.
- CPM up market-wide, ROAS falling: hold bids. Decide whether marginal installs still pay back; don't chase inflation.
- CTR down, ROAS falling: refresh creative, and rotate to fresh audiences if frequency is the driver.
- CVR down on every network at once, ROAS falling: fix or roll back the store change, and coordinate with ASO.
- CVR down on one network, ROAS falling: investigate click quality and ad-to-store consistency on that network.
- Any leg up, but ROAS holding or rising: you're buying better users at a higher price. Find what caused it and replicate it.
PvX Delta is built on this checklist. It runs 100+ deterministic checks from these families across your MMP (AppsFlyer, Adjust or Singular) and your Meta Ads and Google Ads accounts: daily checks every night, weekly checks on their weekly cadence. The validity gate and prioritization run on every pass, and results arrive each morning as a decision brief. There are no prompts to write and no dashboards to build; setup is a data connection. Delta is advisory — it tells you what to change and why, and you make the change. The family-by-family reference is in the PvX Delta check library; how the stages fit together is in how PvX Delta works. If you're comparing approaches, deterministic checks vs anomaly detection covers the trade-off.
Sources
- AppsFlyer: https://support.appsflyer.com/hc/en-us/articles/207447053-AppsFlyer-attribution-model
- AppsFlyer: https://support.appsflyer.com/hc/en-us/articles/4410481130641-Meta-ads-discrepancies
Oct 02, 2026 - 15 min
Sep 29, 2026 - 15 min

Sep 25, 2026 - 10 min
Some of the fastest growing businesses in the industry