


This PvX Partners guide lays out a 100+ item mobile UA audit, run top-down from a statistical validity gate through account-level, dimensional, delivery, and creative checks to final prioritization, each with a formula and cadence. It argues the biggest wins hide in the checks teams usually skip, and pitches PvX Delta as the tool that runs them all nightly.
Oct 02, 2026 - 15 min
A good UA manager runs maybe 20 checks on a good morning. The account in front of them supports more than a hundred distinct ones — each metric family crossed with each dimension it can be sliced by, plus the delivery, creative and prioritization checks that sit on top. This mobile user acquisition audit checklist lists all of them, grouped in the order you should run them, with the formula for each and a link to the guide that explains how to diagnose it. Nobody runs all of it by hand. The point of writing it down is to decide which ones you'll run daily, which weekly, which you'll automate, and which you'll consciously skip.
The checklist mirrors the structure of the PvX Delta audit specification, which is organized the way an experienced UA lead reads an account: from the top down, gated for noise, and deduplicated at the end.
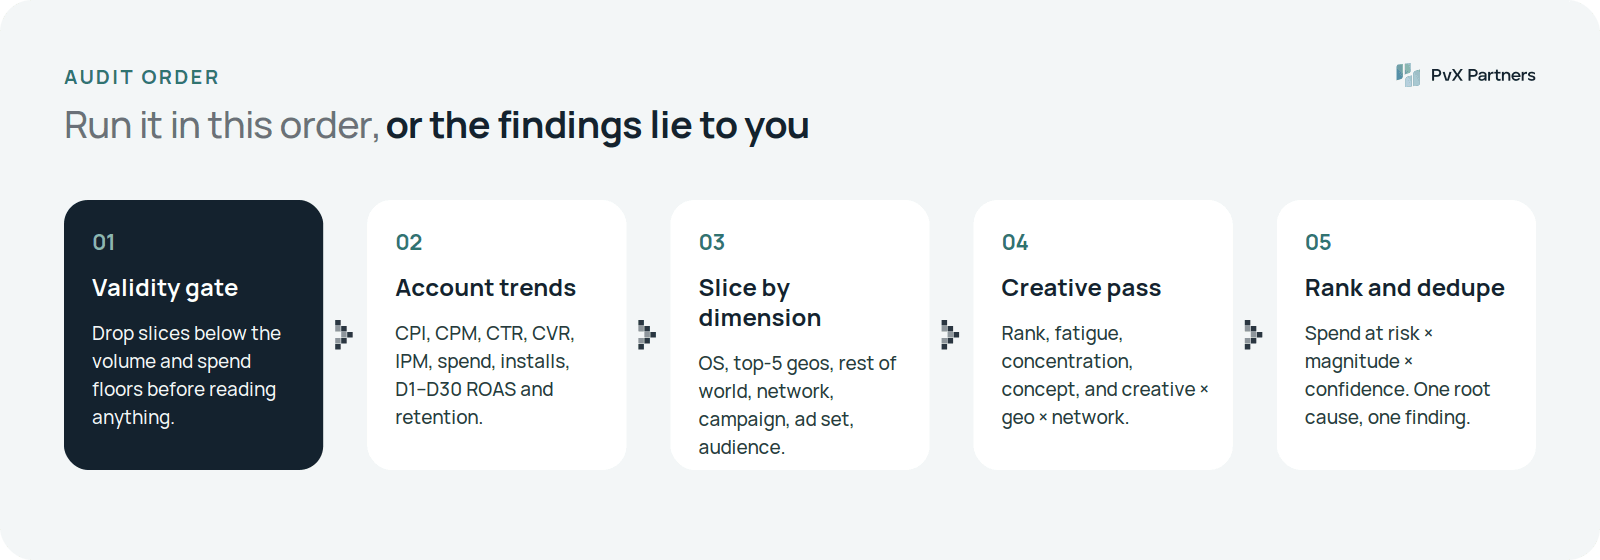
Three rules apply to every item.
Change-in-trend means against the entity's own baseline. Compare the recent window (for example, a 7-day average) to a longer baseline (for example, the prior 28 days) and ask whether the move is outside the metric's normal variance and persistent. A universal benchmark is the wrong yardstick for almost everything below.
"Vs norm" means against peers in the same account. A campaign's ROAS versus other UA campaigns of the same role, a country's CTR versus the blended account — not versus an industry average.
A move at a higher level is a symptom; the cause lives in a slice. Account-level findings tell you where to look, not what to do.
Two of the columns you'll see:
Formula: exactly what to compute.
Guide: where the diagnosis for that check is written up in detail.
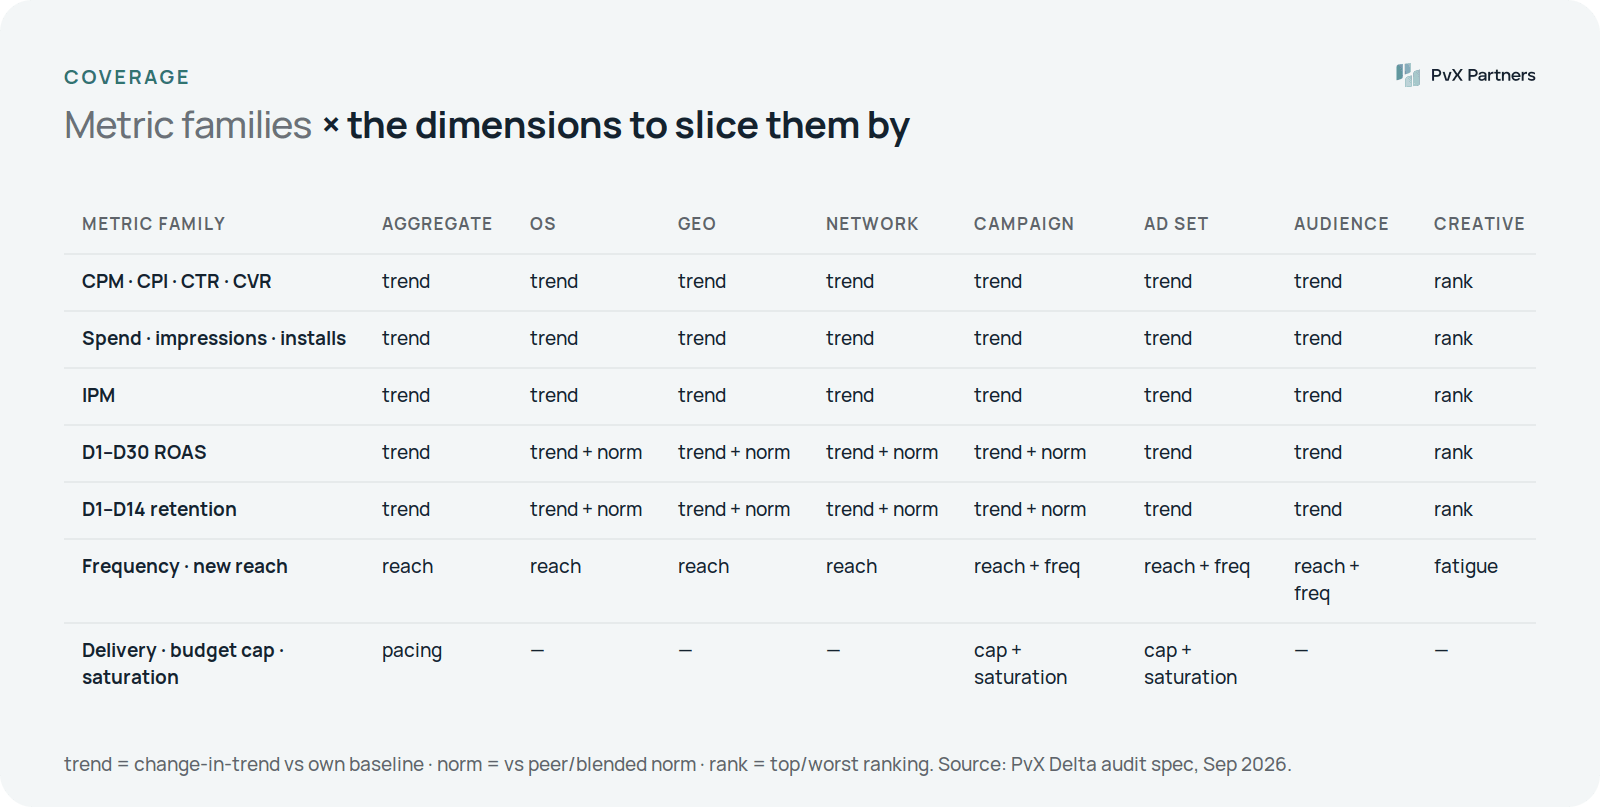
The coverage matrix. Most cells are a change-in-trend check; ROAS and retention also get a vs-norm check at OS, geo, network and campaign level.
Run this before anything else, on every slice. It's the check that makes all the others trustworthy.
Check
Formula / rule
Why
Guide
Validity floor
Slice must have enough volume in the window: a starting point is ≥10,000 impressions and ≥10 installs
Below this, a move is statistically unreadable — the data is insufficient, not the performance
Minimum sample size
Materiality floor
Slice spend ≥5% of its parent's spend or ≥$50/day
A valid finding on 1% of spend rarely outranks anything
same
Rate-metric confidence
95% CI ≈ ±1.96 × √(p(1−p)/n), where n is the denominator (impressions for CTR, clicks for CVR, cohort size for retention)
A 2% CVR needs thousands of daily clicks to read a small move
same
Roll up or pool
If a slice fails, pool over more days or roll up (ad set → campaign → network or geo tier → OS) until it clears
Dropping it hides real problems; reading it raw invents fake ones
same
What the gate looks like on a real run, using the spec's illustrative sample: 412 slices evaluated, 37 suppressed. One ad network's tier-2 Android campaign spent $38 a day — 1.7% of its parent — so it failed materiality despite having valid volume. A UK broad ad set had 6,900 impressions and 8 installs a day, failing validity at daily grain until pooled.
Aggregate first — but remember to agree what "aggregate" means. Paid-only and paid-plus-organic (eCPI, eROAS) give different answers.
#
Check
Formula
Cadence
Guide
1
Budget delivery / pacing
month-to-date spend projected to month-end ÷ planned monthly budget
Daily
Budget pacing
2
CPI trend
spend ÷ installs; decompose into CPM, CTR, CVR
Daily
Why is my CPI increasing?
3
CPM trend
spend ÷ impressions × 1,000
Daily
CPM rising?
4
CTR trend
clicks ÷ impressions
Daily
CTR dropped suddenly?
5
CVR trend
installs ÷ clicks (click-to-install)
Daily
Click-to-install CVR
6
Spend trend
spend vs baseline, without a budget edit
Daily
Unexplained spend change
7
Impressions trend
impressions vs baseline
Daily
Audience saturation
8
Installs trend
installs vs baseline; cross-check MMP vs network
Daily
Installs dropped suddenly
9
IPM trend
installs ÷ impressions × 1,000 (= CTR × CVR × 1,000)
Daily
IPM explained
10
Net new reach trend
people reached this window who weren't last window
Daily
Reach declining
11
D1–D30 ROAS trend
cohort revenue through day X ÷ cohort spend, matured cohorts
Weekly
ROAS dropping?
12
D1–D14 retention trend
users active on day X ÷ cohort installs
Weekly
Retention drop by cohort
Clicks trend is deliberately missing. Clicks alone don't diagnose anything that CTR and CVR don't already cover, so the spec deleted those checks.
Two readings from the spec's illustrative samples show why Stage 1 is only a starting point:
CPI +18% in a week: 46% of the move was CPM, 34% CTR, 20% CVR. The CPM part was two separable causes — one network's bidder update and a Korea-wide auction jump.
CVR −16% across every network on the same day: a store-listing screenshot experiment had gone live. The campaigns were fine; the store wasn't.
<a id="stage-2"></a>
Stage 2: slice by dimension
Run the same metric families down each dimension. The dimension that isolates the move usually names the cause.
OS
Check
Formula / rule
Cadence
Guide
CPM, CPI, CTR, CVR, spend, impressions, installs, IPM, new reach — trend by OS
Each metric vs that OS's own baseline
Daily
iOS vs Android divergence
D1–D30 ROAS and D1–D14 retention — trend by OS
Matured cohorts, same age
Daily
ROAS dropping?
ROAS and retention vs norm by OS
OS value ÷ blended value
Weekly
same
Never judge iOS against Android. Their auctions, attribution (ATT, SKAN, AdAttributionKit modeling) and user economics are structurally different. A synchronized iOS-only cliff across every campaign on one date is usually measurement — see SKAN and AdAttributionKit for UA analysis.
Geo: top five countries by name
Check
Formula / rule
Cadence
Guide
All delivery and cost metrics, IPM and new reach — trend per top-five country
Each country vs its own baseline
Daily
Why is my CPI increasing?
ROAS and retention trend per top-five country
Matured cohorts
Daily
ROAS dropping?
CTR, ROAS and retention vs norm per country
Country ÷ peer/blended
Weekly
Benchmark against account norm
Rising geo identification
Countries with growing volume and ROAS at or above norm that aren't yet top five
Weekly
Rising geos
Geo: rest of world as one cluster
Check
Formula / rule
Cadence
Guide
Same metric families, pooled across all non-top-five countries
One cluster, so small markets don't flood the read
Daily
Tier-2 and rest-of-world analysis
Countries carry their own holidays, sales events, FX effects and localization problems. In one spec sample, Japan's CPI rose 13% entirely through CVR because a seasonal store update had shipped English-only screenshots.
Network
Check
Formula / rule
Cadence
Guide
CPM, CPI, CTR, CVR, spend, impressions, installs, IPM, new reach — trend per network
Each network vs its own baseline
Daily
Network-level divergence
ROAS and retention trend per network
Matured cohorts
Daily
ROAS dropping?
ROAS and retention vs norm per network
Network ÷ blended
Weekly
same
A move on every network is the market or your store. A move on one network is that network.
Campaign
Check
Formula / rule
Cadence
Guide
All metric families — trend per campaign
Each campaign vs its own baseline
Daily
Why is my CPI increasing?
CTR, CVR, ROAS, retention vs norm
Campaign ÷ peer campaigns of the same role
Weekly
Benchmark against account norm
Frequency vs norm
Campaign frequency ÷ role-specific norm; retargeting judged only against itself
Weekly
Ad frequency too high?
Ad set / ad group
Check
Formula / rule
Cadence
Guide
All metric families — trend per ad set
Each ad set vs its own baseline
Daily
Ad set performance analysis
Frequency vs norm
As above
Weekly
Ad frequency too high?
Blended campaign metrics hide ad set failures, especially with campaign-level budget optimization. The ad set is often where the actual problem lives.
Audience (parsed from campaign names)
Check
Formula / rule
Cadence
Guide
Metric families by audience type (broad, lookalike %, interest, retargeting)
Parsed from naming convention
Daily
Audience performance analysis
Frequency vs norm by audience type
As above
Weekly
Ad frequency too high?
This only works if names are machine-readable. If your naming is inconsistent, fix that first: campaign naming convention.
Placement
Placement mix (Reels, Stories, Feed, Audience Network; Google's channels) matters, but Meta's API doesn't currently expose placement cleanly enough to run this at the same depth as the rest. Treat it as a manual review for now: placement performance for app campaigns.
These don't fit the "metric × dimension" grid. They look for specific delivery conditions.
Check
Formula / rule
Level
Cadence
Guide
Budget-capped winners
Utilization (spend ÷ budget) ≥ ~95% for several days and Dx ROAS above target on matured cohorts and frequency not rising
Campaign, ad set
Daily
Budget-capped winners
Audience exhausted
Spend flat or up + impressions flat or down + frequency up + new reach flat or down, together
Campaign, ad set
Daily
Audience saturation
Ad disapprovals
Any disapproved or limited ad, weighted by the spend share it previously carried
Ad
Daily
Ad disapproval monitoring
Learning-phase status
Entities that haven't exited learning after a reasonable window
Campaign, ad set
Daily
Learning phase in app campaigns
The last row is a manual review item rather than something to automate blindly: the right call depends on the bid strategy and recent edits. Background is in cost cap vs bid cap vs lowest cost.
A worked example of the capped-winner check, from the spec's illustrative sample: a US iOS campaign at 99.5% utilization over three days, D30 ROAS 1.66× the account norm, frequency up only 5% and new reach still growing. The last budget raise moved CPI just 4.8%. The call was one +25% step, then watch.
Creative checks run at ad level, mostly weekly, and are the checks humans skip most often because they're the most tedious.
#
Check
Formula / rule
Cadence
Guide
1
Top/worst ranking by IPM
installs ÷ impressions × 1,000, above the volume floor
Weekly
Top and worst creative ranking
2
Ranking by CPI, CTR, CVR
Standard definitions, ranked
Weekly
same
3
Ranking by spend and impressions
Share of total
Weekly
same
4
Ranking by D7 retention and Dx ROAS
Matured cohorts; screen for whales
Weekly
same
5
Creative fatigue
CTR vs lifetime peak, frequency, creative age since first delivery in the ad set, IPM; D7 ROAS as tie-breaker
Daily
Creative fatigue detection
6
Spend concentration
Top creative's share of spend
Weekly
Creative concentration risk
7
Install concentration
Top creative's share of installs
Weekly
same
8
Performance by concept / art style
IPM, CPI, CTR, CVR, spend, impressions, retention, ROAS rolled up by concept parsed from creative names
Weekly
Creative concept and art style
9
Creative × geo × network cross-cut
The same metric families per creative, per country, per network
Weekly
Creative performance by country and network
10
Performance by format (video, playable, static)
Same metric families by format
Weekly (manual for now)
Creative format performance
Two cautions from the spec. First, per-creative ROAS is the noisiest ranking you can build: in one illustrative sample, the raw #1 creative at 88% D7 ROAS turned out to have one $4.2k payer carrying 71% of its cohort's revenue. Second, rank on efficiency (IPM) and outcome (D7 ROAS), not spend — the two lists disagree, and the disagreement is where the insight is. Format data is currently unavailable on Meta and only partly available on Google, which is why row 10 is a manual review. The upstream process is in a creative testing framework for mobile apps.
Without this step, the checks above will drown you. One root cause fires at many depths at once: a single network's CPM spike trips aggregate, OS, geo and campaign CPM checks simultaneously.
Step
Rule
Guide
Dedupe
Group co-triggered flags by common cause (same entity subtree, same start date, same direction); report the deepest common cause once
Spend at risk prioritization
Override
Data integrity and account-level risk (tracking breaks, disapprovals, billing) outrank everything else, regardless of score
same
Order
Delivery findings before performance findings on the same entity — under-delivery corrupts the performance read
same
Score
spend at risk × magnitude of deviation × statistical confidence
same
Post-change review
Did the last bid, budget or creative change work? Compare the 72 hours after against the baseline
Measuring the impact of campaign changes
In the spec's illustrative prioritization run, 41 open flags collapsed to 14 findings. Two data-integrity issues went to the top by rule, and five were surfaced by score. The remaining nine went to a watchlist.
Daily
Weekly
Validity gate (every run)
Aggregate ROAS and retention trend
Pacing
All vs-norm checks (ROAS, retention, CTR, CVR, frequency)
CPM, CPI, CTR, CVR, spend, impressions, installs, IPM, new reach — all dimensions
Creative rankings, concentration, concept, cross-cut
ROAS and retention trend below aggregate
Rising geo identification
Budget-capped, audience exhausted, disapprovals
Creative fatigue
Prioritization
The logic: delivery metrics move and can be fixed daily. Cohort metrics need time to mature and are noisy at daily grain, so their norms are judged weekly. Why that split matters is in which UA checks to run daily and which weekly. How to tell a genuine shift from noise is in detecting trend changes in UA metrics.
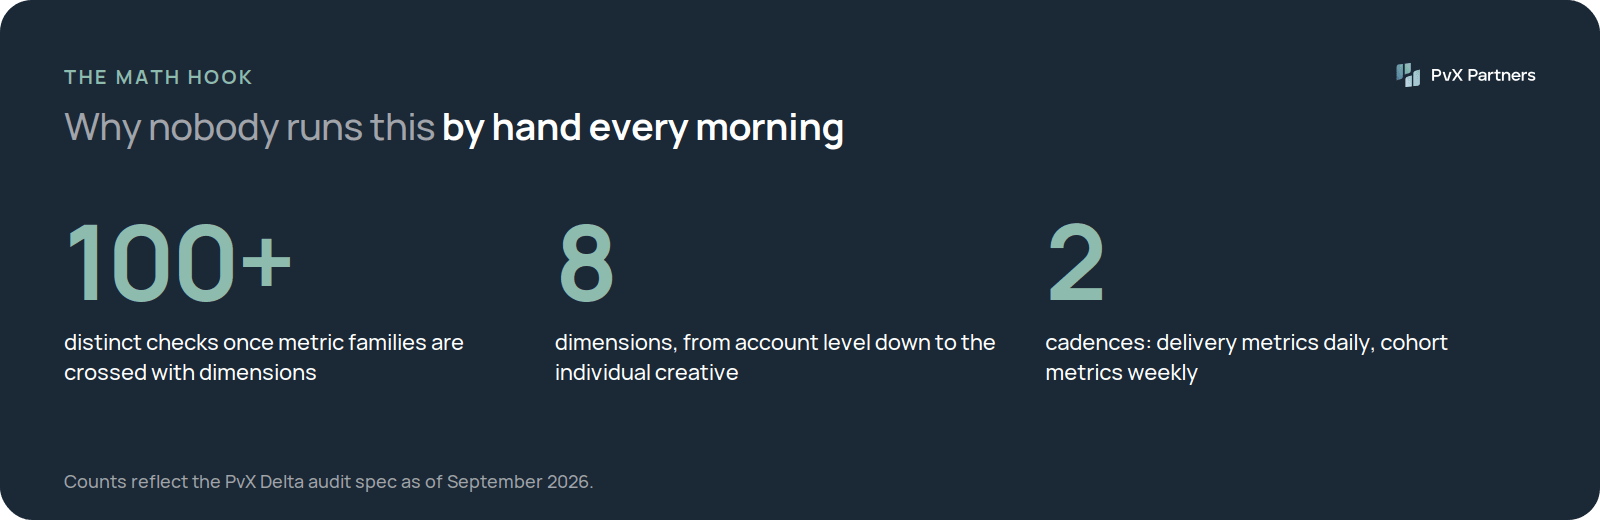
Run the math on a mid-size account: a dozen metric families across five countries plus a rest-of-world cluster, four networks, 30 campaigns and 80 ad sets, re-read every day against a baseline. Add the weekly creative pass over a few hundred ads. No one reads all of that before stand-up. What gets skipped follows a pattern:
Everything below the campaign level. Ad set failures hidden inside healthy campaign averages.
Rest-of-world. Small markets aren't worth individual attention, so nobody looks at them as a cluster either.
Vs-norm checks. Comparing an entity to its peers takes a spreadsheet; comparing it to yesterday takes a glance.
Upside checks. Budget-capped winners and rising geos. Audits are built to find damage, so opportunities go unnoticed.
Creative cross-cuts. A creative winning in one country and never tested in another.
The gate. Without it, people either chase noise or learn to ignore alerts.
The 25 checks with the most spend at risk when skipped — and the one-line formula for each — are in 25 mobile UA checks every team should automate. How to set up the daily review itself is in how to automate your daily UA campaign review.
The checks are the same for every mobile app; what changes is which day you judge on and which dimension carries the most risk.
App type
Judge ROAS on
Watch hardest
Common trap
Hyper-casual / hybrid-casual game (ad-monetized)
D1–D7
Creative fatigue and concentration; CPM by network
Creatives burn out in days; a weekly creative pass is too slow on its own
Midcore or strategy game (IAP, payer tail)
D7 with a D30 confirmation
Whale screens on every ROAS check; rising geos
Cutting campaigns on D7 that pay back at D30+
Subscription app with a free trial
Trial-start rate and D30+ revenue, not D7 ROAS
CVR (store page and trial-start step); retention by source
D7 ROAS near zero on campaigns that are healthy
Marketplace or commerce app
First-purchase rate and D30 ROAS
Geo-level CVR; OS split
Promotions distorting both CPI and ROAS at once
For games, the store page and the first session carry most of the CVR and D1 retention risk. For subscription apps, the equivalent is the paywall: a trial-start drop that hits every network on the same day is a product change, not a media one. Either way, pair the gaming example with the non-gaming one when you set thresholds — the mechanics differ even where the checks don't.
How often should I run a full UA audit? Split it. Delivery and cost checks daily, cohort and vs-norm checks weekly, and a full top-to-bottom review (including naming hygiene and attribution settings) monthly or after any major account restructure.
Which checks should a small team run first? The validity gate, the account-level CPI decomposition, ROAS trend on matured cohorts, creative fatigue on your top five creatives by spend, and the budget-capped winners check. That set catches most of the money at stake.
Do I need an MMP to run this checklist? For the delivery and cost checks, no — the ad networks report those. For ROAS, retention and cross-network comparisons, yes. Network-reported conversions can't be compared across networks on the same basis.
What about SKAN and AdAttributionKit? Treat iOS cohort metrics as partly modeled. Read iOS against its own history, and treat synchronized iOS-only step changes as a measurement question first.
PvX Delta is built on this checklist. It runs 100+ deterministic checks from these families across your MMP (AppsFlyer, Adjust or Singular) and your Meta Ads and Google Ads accounts: daily checks every night, weekly checks on their weekly cadence. The validity gate and prioritization run on every pass, and results arrive each morning as a decision brief. There are no prompts to write and no dashboards to build; setup is a data connection. Delta is advisory — it tells you what to change and why, and you make the change. The family-by-family reference is in the PvX Delta check library; how the stages fit together is in how PvX Delta works. If you're comparing approaches, deterministic checks vs anomaly detection covers the trade-off.
Some of the fastest growing businesses in the industry