


Sep 25, 2026 - 10 minutes
Creative fatigue detection is the practice of spotting when an ad has stopped earning attention from the people it is being shown to, early enough to replace it before CPI and ROAS take the hit. In mobile app campaigns the signature is a creative's CTR falling from its own peak while frequency rises and net new reach flattens, all scaled by how long the creative has been running. The catch most guides skip: the same CTR drop has two different causes — the audience pool is saturated, or the concept itself has worn out in the market — and they need opposite fixes.
In this guide: Why it costs more than it looks · The four signals · Detect it by dimension · False positives · What to do · How PvX Delta checks this
What is creative fatigue, and how do you detect it?
Fatigue is the default decay path of every creative. Audiences wear ads out; nobody sees the same hook six times and taps it with the enthusiasm of the first. Detecting it comes down to reading four numbers together at ad level, inside each ad set:
CTR against the creative's own lifetime peak — not against an industry benchmark. An ad at 0.6% CTR that launched at 0.6% is healthy; an ad at 1.2% that peaked at 1.8% is decaying.
Frequency (impressions ÷ reach) — is spend being recycled into the same people?
Creative age — days since the creative first delivered in that ad set.
IPM (installs per 1,000 impressions) — did the decay reach the install line, or is it only a click-level wobble?
Then one tie-breaker from your MMP: D7 ROAS on matured cohorts. A fatiguing creative still clearing target has runway; one that has slipped under it needs replacing this week.
eCommerce ad tools stop at CTR, frequency and CPA. For app campaigns that is half the picture — the install and cohort layer is where you find out whether a CTR decline actually cost you anything.
<a id="why-it-matters"></a>
Why creative fatigue costs more than it looks
Here is a worked example from the PvX Delta audit spec's sample results. It is a fictional account, and the numbers are illustrative.
A 30-second challenge video (VID_hook3_challenge_30s) has been running for 47 days in a Korea broad ad set. Over a 14-day view:
Signal
Reading
Threshold used
CTR, 7-day avg vs lifetime peak
0.92% vs 1.31% → −29.8%
−20% from peak
Days of consecutive CTR decline
11
several days, not one
Frequency
2.1 → 2.9 (+38%)
+25%
Net new reach
−24%
flattening
IPM
3.4 → 2.5 (−26%)
falling with CTR
Creative age
47 days
14-day floor
Down-funnel so far
CPI +11%, ROAS still above target
—
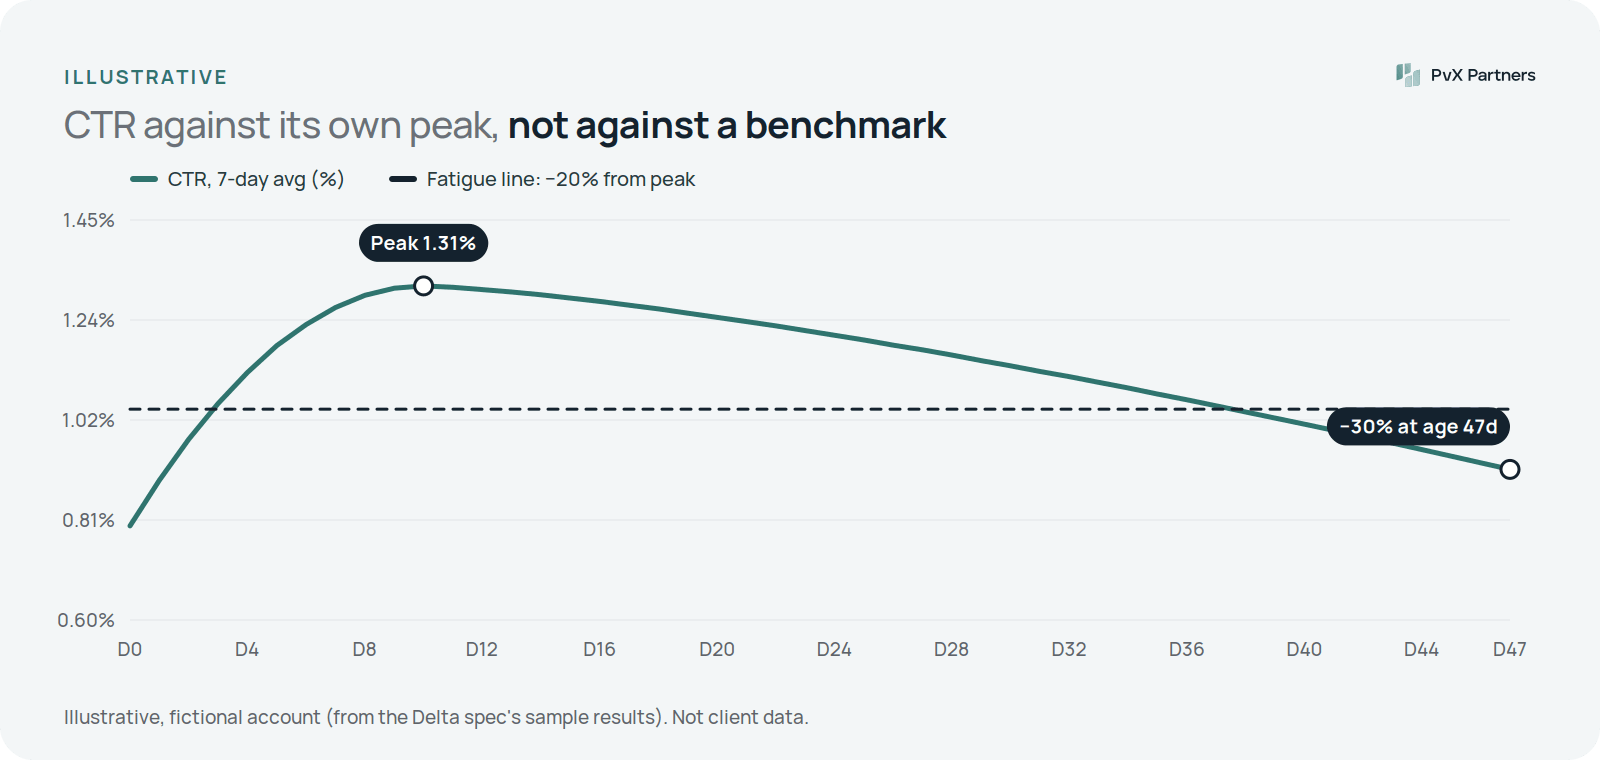
The only benchmark that matters is the creative's own peak. Illustrative data.
The expensive part is not the 30% CTR loss. It is what happens next if nobody acts: the platform keeps paying to re-reach the same people, CPM inflates, IPM keeps falling, and the CPI alarm fires two weeks after the problem started. By then a winning creative has spent a fortnight converting fewer impressions into installs, and the replacement hasn't been briefed. Catching fatigue at the "CPI +11%, ROAS still above target" stage buys you the time to ship a successor.
<a id="signals"></a>
The four signals and their formulas
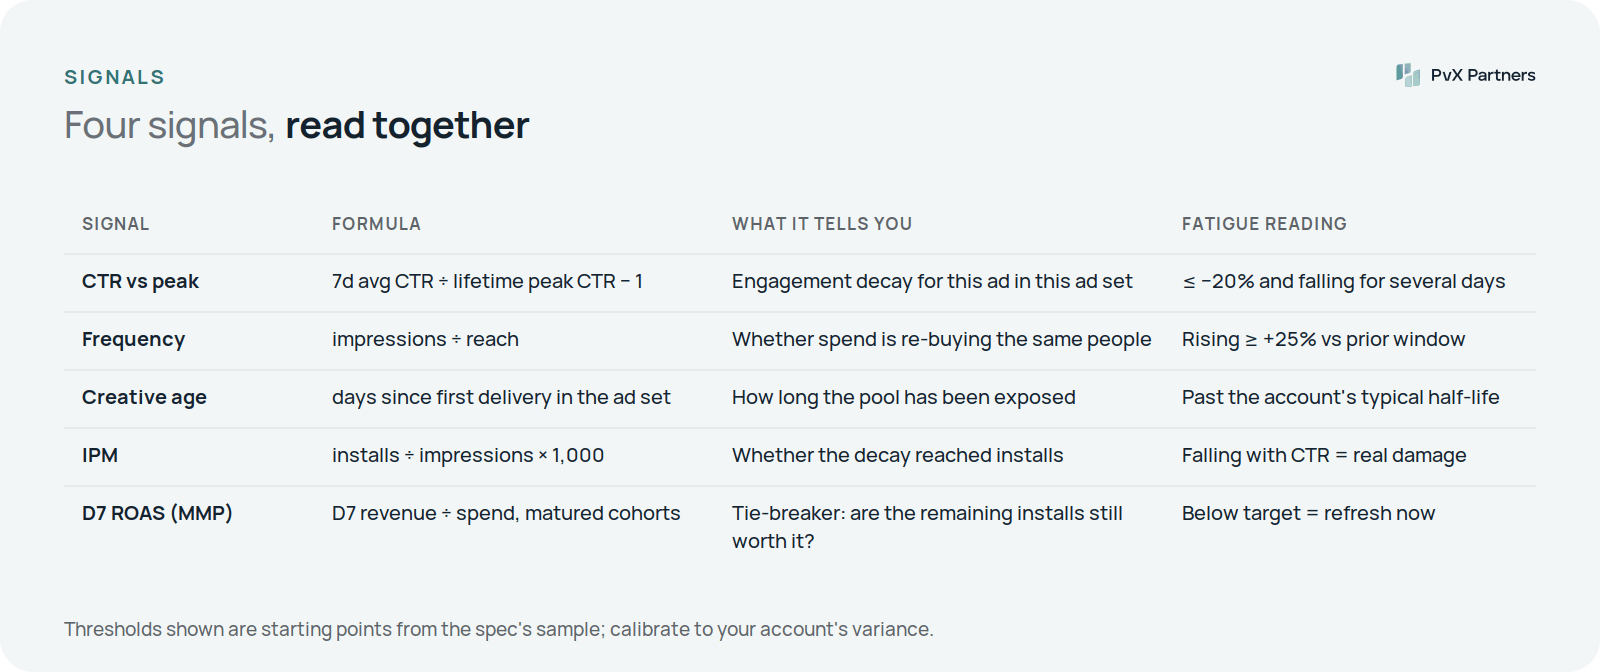
CTR vs peak = (7-day average CTR ÷ lifetime peak CTR) − 1. Use the 7-day average; daily CTR on a mid-spend ad is too noisy to judge.
Frequency = impressions ÷ reach. Compare the current window to the prior window of the same length. The absolute number is less useful than its slope.
Creative age = days since first delivery in the ad set, not since upload. The same asset can be fresh in one audience and exhausted in another. Weight age by spend when judging a whole set of creatives.
IPM = installs ÷ impressions × 1,000. IPM equals CTR × CVR × 1,000, so it tells you whether the engagement loss made it through to installs. See our IPM guide.
The thresholds in the table above (−20% CTR from peak, +25% frequency, a 14-day age floor) are starting points from the spec's sample, not universal constants. Calibrate them to your account: a hyper-casual game running 40 creatives a week decays faster than a subscription app running six.
Saturation or wear-out? The distinction that picks the fix

The hardest call in creative fatigue detection is why CTR is falling.
Frequency up, reach flat, CTR down → pool saturation. This audience has seen the ad too often. The creative may be fine. Rotate it into a fresh audience or broaden targeting before you kill it. (Our audience saturation guide covers the delivery-side signature.)
CTR down at stable frequency → concept wear-out. The market is tired of the idea, not just this pool. A re-cut of the same hook won't fix it; you need a new concept.
In the worked example, the same asset served to a fresh Korean interest pool recovered to 1.15% CTR. Verdict: the pool was tired, not the concept. The right action was to cap the video at roughly half its delivery in the saturated ad set, re-enter it in the fresh pool, and ship the successor creatives that week.
<a id="by-dimension"></a>
How to detect creative fatigue by dimension
Fatigue is judged at the ad level, but you only find it by working down from the top.
Account level
An aggregate CTR decline with no settings change is usually creative. At this level it is a symptom: it tells you to run the creative pass, not which creative to replace. If targeting, optimization event or placements changed recently, the baseline resets. Re-establish it before judging.
OS
iOS and Android audiences, auctions and creative preferences differ. A creative can fatigue on Android weeks before iOS. Judge each OS against its own history.
Geo (top five markets by name, then rest of world)
Small markets wear creatives out faster. If fatigue shows in one country only, it is pool-local: rotate the audience there and keep the creative running elsewhere. If it shows in every market at once, the concept is done.
Network
Meta, Google, TikTok and ad networks show the same asset to different people at different rates. A creative can be fresh on Google and exhausted on Meta. If the same asset runs on several networks, the lagging one will follow — stagger the rotation instead of swapping everywhere on the same day.
Campaign and ad set
This is where the fatigue signature is read. Blended campaign CTR can look stable while one ad set's lead creative decays, because a newer ad is carrying the average. Break it down to the ad set.
Creative
Rank creatives by IPM and D7 ROAS, not by spend. The spend-weighted creative age of your top five tells you how exposed you are. If most of the budget sits on assets older than their typical half-life, you have a fatigue queue forming. Pair this with top and worst creative ranking and creative concentration risk.
<a id="false-positives"></a>
Common false positives
Thin volume. A 20% CTR drop on 3,000 impressions a day is noise. For a rate metric, the 95% confidence interval is roughly ±1.96 × √(p(1−p)/n), where n is impressions. Apply a volume and spend floor before any flag (minimum sample size guide).
A settings change. New targeting, a new optimization event, or a placement change moves CTR for reasons unrelated to the creative. Re-baseline from the change date.
Mix shift posing as recovery. An apparent CTR rebound is often delivery moving to a new placement or geo, not the creative recovering. Check before celebrating.
Seasonality. Holiday auctions change who you reach. If every creative's CTR dropped on the same day, look at the calendar, not the creative (seasonality vs anomaly).
Novelty spikes. New creatives often start hot and settle. A decline from a three-day launch spike isn't fatigue; measure from the settled peak.
<a id="what-to-do"></a>
What to do when you detect creative fatigue
The response depends on how far the decay has gone and whether a successor is ready. Refresh too early and you waste a working ad; refresh too late and the KPI breach has already happened.
Situation
Action
Advanced fatigue, successor ready (comparable IPM in test)
Rotate now: pause or de-weight the fatigued ad
Advanced fatigue, no successor
Brief production urgently; cap the ad's spend to slow the burn while replacements are built
Early fatigue, KPI holding
Keep riding it; plan succession. Do not kill a working ad prematurely
Saturation-driven (frequency up, reach flat)
Rotate to a fresh audience or broaden before killing the creative
Concept wear-out (CTR down at stable frequency)
Brief a new concept, not a re-cut of the old one
How often to refresh is best answered by signal rather than by a fixed number of days — see how often to refresh ad creative. The creative pipeline behind it is the subject of our post The Advertising Arms Race: Get Creative or Get Cut.
<a id="delta"></a>
PvX Delta runs its creative-fatigue check daily at ad level inside every ad set, after the account-level and campaign-level CTR trend checks point it toward the creative pass. It reads CTR against each creative's own peak, spend-weighted creative age and IPM from the ad networks, then joins D7 ROAS on matured cohorts from your MMP to decide whether the decay has reached the business line. [It adds the frequency and net-new-reach legs to separate pool saturation from concept wear-out.] Slices below the volume and spend floors are suppressed before anything is flagged. Findings arrive in the morning decision brief, ranked by spend at risk. Delta is advisory: it tells you which creative to rotate and why, and you make the change.
Sources
AppsFlyer: Creative Optimization guide
Adjust: Pulse anomaly detection alerts
Some of the fastest growing businesses in the industry