


Compare same-age cohorts, not calendar days. Then find the geo, network or campaign behind the drop before you cut something that was working.
Sep 29, 2026 - 15 min

Most "ROAS is dropping" alarms are false. The dashboard compares last week's installs against installs from a month ago, and of course the young cohorts look worse — they've had less time to pay. Of the real declines, most trace back to one of three legs: you paid more per install (CAC), users paid less once acquired (ARPU), or spend drifted toward weaker segments (mix). A fourth, rarer case is a data break that looks like a performance collapse. This guide gives you a cohort-native method to tell them apart, then localize the real ones to the geo, network, campaign or creative where they live.
Compare cohorts of the same age — D7 against D7 — on matured windows only. If the decline survives that, split it into CAC, ARPU and mix, then slice by OS, geo, network, campaign and creative. A drop across every segment on the same date is usually data, not performance: check your MMP before you move budget.
Dx ROAS is the one metric where direction does carry meaning: down is bad. But the number has to be validated before it's trusted, because recent cohorts are structurally immature and small cohorts can be swung by a single large payer.
A cumulative ROAS curve rises for weeks after install. If you read "ROAS for installs in the last 7 days" today, you're mixing a 1-day-old cohort with a 7-day-old one. Every day, the average will look worse than a mature month.
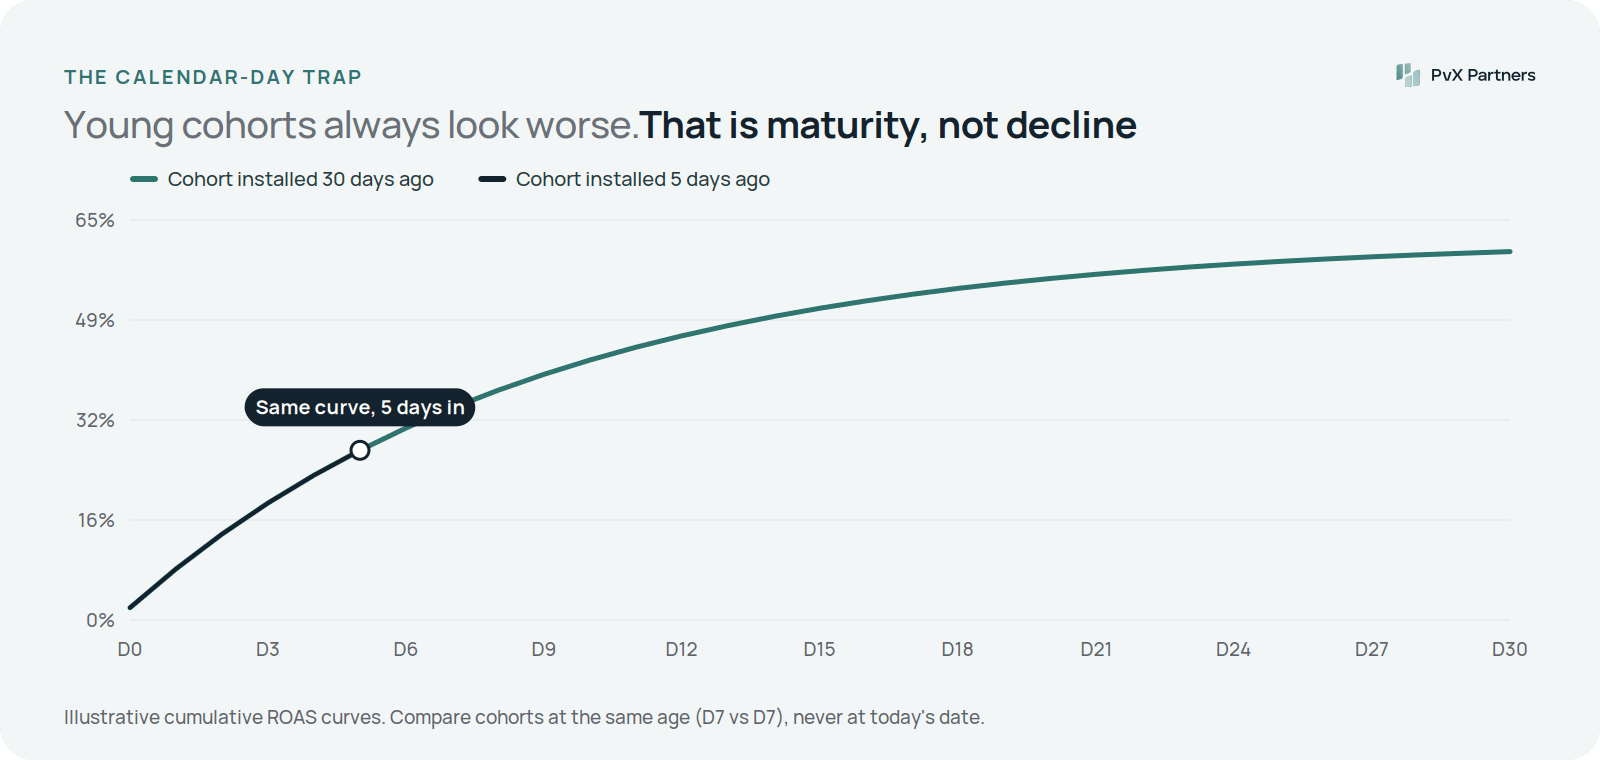
The five-day-old cohort isn't underperforming. It's five days old. Illustrative data.
The fix is to index by cohort age, not by calendar date. Compare D7 ROAS of cohorts that have all reached day 7, and exclude the immature tail: any cohort younger than the ROAS day you're reading, plus the attribution-lag days after it. Our D7 ROAS explainer covers why teams anchor on D7, and attribution windows covers which days are closed and safe to judge.
Dx ROAS = Dx revenue per install ÷ CPI
So a ROAS decline has to come from revenue per install falling (ARPU leg), CPI rising (CAC leg), or the blend of segments changing (mix leg).
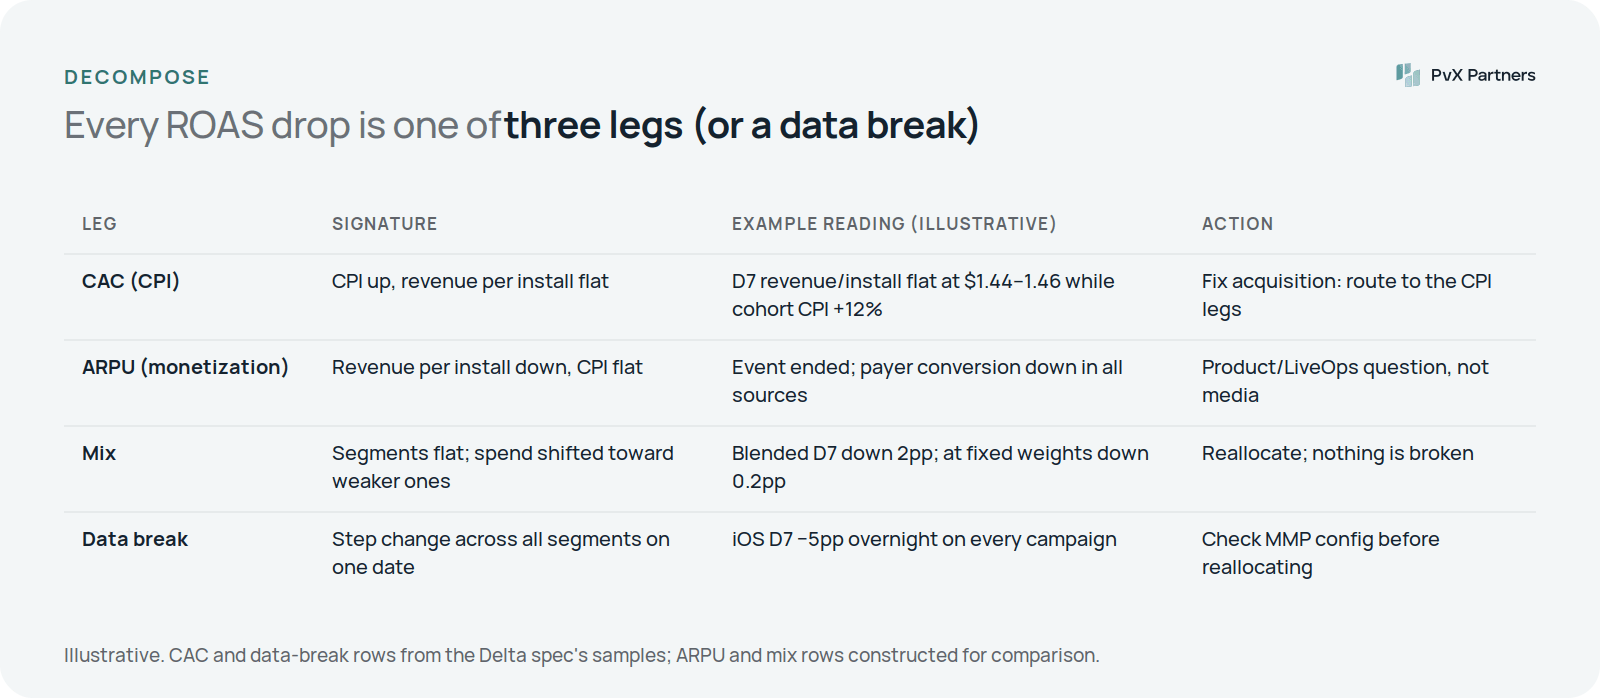
CAC leg: CPI up while revenue per install is flat. The fix lives in acquisition — go to the three CPI legs in why is my CPI increasing?
ARPU leg: revenue per install down while CPI is flat. That's product-side — an event ended, a price changed, content ran dry. Media changes won't fix it.
Mix leg: each segment's ROAS is flat, but spend moved toward the weaker ones. Recompute the account's ROAS at fixed segment weights. If the decline disappears, nothing is broken; you have an allocation choice to revisit.
Data break: a step change on a single date, across every campaign and every network. Tracking, SDK, SKAN or MMP modeling changes do this. Performance rarely does.
From the PvX Delta audit spec's sample results (a fictional account; illustrative numbers).
Aggregate D7 ROAS on matured cohorts only: 42.1% → 40.9% → 39.4% across three weekly reads, now under a 40% target.
Test
Result
Verdict
Maturity
Immature tail excluded; the decline holds
Real
ARPU leg
D7 revenue per install flat at $1.44–1.46
Healthy
CAC leg
Cohort CPI up ~12% over the same span
The cause
Rate vs mix
At fixed segment weights, still −2.3pp
Not mix
Whale check
Top payer = 4% of window revenue
No distortion
Data break?
Gradual, worst in two slices, not synchronized
Not data
With CAC confirmed, the CPI legs took over: one ad network's CPM inflation and a Korea-wide auction jump, plus Meta creative fatigue. The action was to fix acquisition economics on those slices and move about 10% of spend toward segments whose marginal D7 ROAS still cleared 40% (US iOS value, Brazil), then re-read next week.
A second spec sample shows the opposite verdict. iOS D7 ROAS fell from 38.1% to 33.2% in one week, simultaneously across every iOS campaign, geo and network. CPI was flat; revenue per install dropped 12% in a single step on one date — the day the MMP's SKAN revenue-modeling setting changed. Verdict: measurement artifact. Do not reallocate on it.
OS
iOS and Android are structurally different: different auctions, different attribution (ATT, SKAN and AdAttributionKit modeling on iOS), different user economics. Judge each against its own history, never against the other OS. iOS-only cliffs deserve a measurement check first (SKAN and AdAttributionKit for UA analysis).
Geo: top five markets by name, rest of world clustered
A top-five country's decline is material on its own. Cluster the long tail so a handful of small-market cohorts don't swing the read. Local events — holidays, pricing, localization errors — show up here.
Network
If one network's ROAS fell and others held, the cause is that network: its auction, its traffic quality, or a bidder change. If every network fell together, look at monetization or measurement.
Campaign and ad set
Rank campaigns by ROAS versus the account norm and by spend. The finding that matters is a campaign carrying real spend that dropped below target, not a small test that was never above it. Also check for recent budget increases — scaling into lower-intent audiences lowers ROAS mechanically — and benchmark campaigns against the account norm rather than a fixed number.
Audience
Broad, lookalike and interest audiences mature differently. Parse audience type from campaign names and compare like with like.
Creative
Per-creative ROAS is the noisiest ranking you can build: thin cohorts, whale-sensitive, immature tails. In the spec's creative-ranking sample, the raw top creative showed 88% D7 ROAS — but one $4.2k payer was 71% of its cohort's revenue. Queue that one for a longer window and rank only the valid rows (top and worst creative ranking).
Immaturity. Reading young cohorts as a decline. By far the most common.
Whales. One large payer carrying a small cohort, in either direction.
Mix. Blended ROAS falling while every segment is flat (blended ROAS vs channel ROAS).
Measurement changes. SKAN conversion-value schemas, AdAttributionKit rollout, MMP modeling settings, SDK releases. All produce synchronized step changes.
Setting changes. A new optimization event or a big budget change resets the baseline. Re-baseline from the change date.
Thin segments. Below the volume floor, ROAS is unreadable (minimum sample size).
Diagnosis
Action
CAC-driven, local
Fix the broken CPI leg in that slice; shift spend toward segments whose marginal ROAS still clears target
CAC-driven, market-wide
Hold bids; accept lower volume at target rather than chasing inflation
ARPU-driven
Take it to product/LiveOps; media changes won't fix monetization
Mix-driven
Revisit allocation; nothing is broken
Data break
Verify MMP, SDK and SKAN configuration; freeze reallocation until the data is trusted
Real, slice-specific decline below target
Pause or cut the losing segment, or shift mix away from it
Where the target line itself should sit is the subject of What Should Your ROAS Target Actually Be?. The opposite case, a winner being held back by its cap, is in budget-capped winners. When retention drops before ROAS does, see retention drop by acquisition cohort.
PvX Delta reads D1–D30 ROAS from your MMP on cohort base date, never on calendar date. The aggregate trend runs weekly; OS, geo, network, campaign, ad set and parsed-audience trends run daily; creative ROAS rankings run weekly (spec A01.10 through A10.8). Each flag is tested on matured cohorts, decomposed into CAC, ARPU and mix, screened for whales, and checked for synchronized cross-segment breaks that point to data rather than performance. It joins the CPI legs from Meta Ads and Google Ads so a CAC-driven decline arrives with its cause attached. Delta is advisory: it names the leg, the slice and the recommended move, and you make it.
Sources
AppsFlyer: set up lookback windows
AppsFlyer: attribution model
Some of the fastest growing businesses in the industry