


The cost-per-install formula, why CPI can only move through CPM, CTR and CVR, and a worked decomposition of an 18% CPI increase into its three legs.
Oct 16, 2026 - 10 minutes
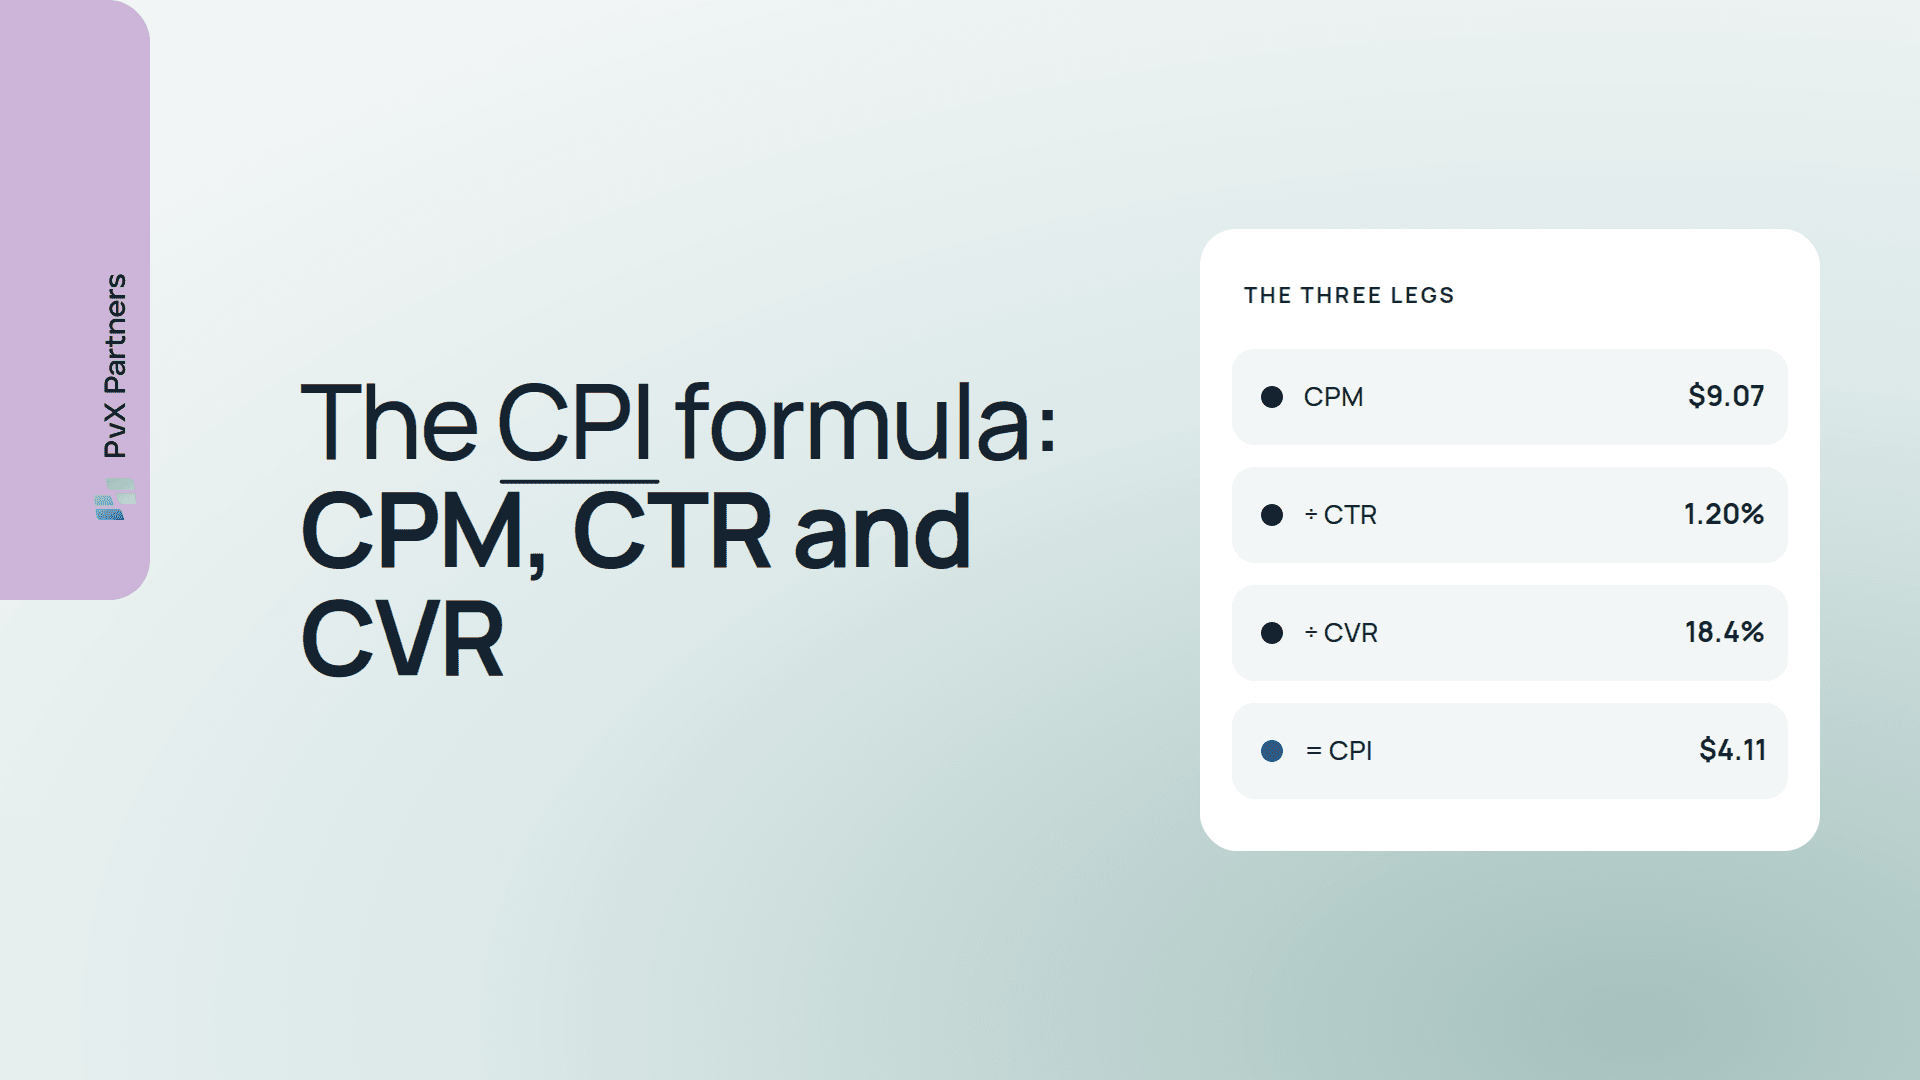
The cost per install (CPI) formula is spend divided by installs. That's how you calculate CPI, but it isn't how you diagnose it. The useful version breaks CPI into the three things you actually pay for: the price of impressions (CPM), the share of impressions that get a click (CTR), and the share of clicks that become an install (CVR). Every CPI move, in every app campaign on every network, is some combination of those three legs plus a mix effect. Learn the formula once and you'll never again answer "why did CPI go up?" with a guess.
CPI = spend ÷ installs
Expanded into its legs:
CPI = (CPM ÷ 1,000) ÷ (CTR × CVR)
where
The ÷ 1,000 converts CPM into cost per single impression. Some write it as CPI = CPM ÷ (CTR × CVR × 1,000), which is the same thing. And since CTR × CVR × 1,000 is IPM (installs per thousand impressions), there's a compact form: CPI = CPM ÷ IPM.
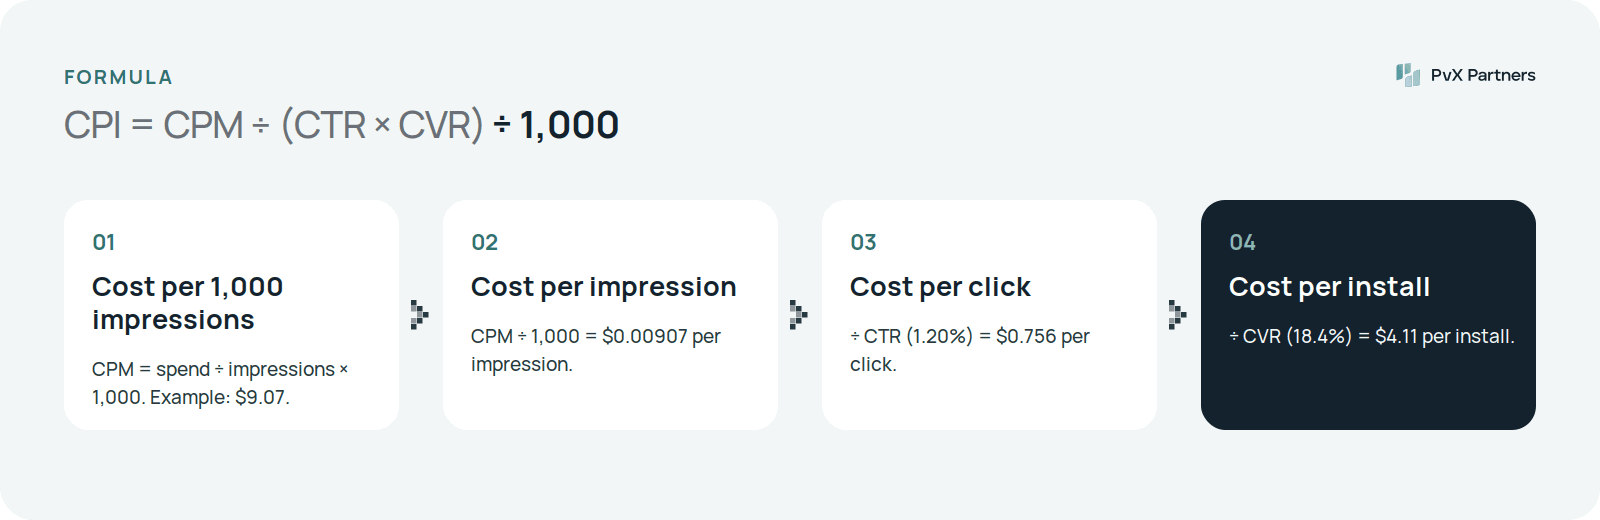
Take an illustrative campaign with CPM $9.07, CTR 1.20% and CVR 18.4%:
Check it the other way: IPM = 0.012 × 0.184 × 1,000 = 2.21 installs per thousand impressions, and $9.07 ÷ 2.21 = $4.11. Same answer.
CPM sits in the numerator, so a 10% CPM rise lifts CPI by exactly 10%. CTR and CVR sit in the denominator, so a 10% drop in either raises CPI by 1 ÷ 0.9 − 1 = 11.1%. Drops in both compound: 1 ÷ (0.9 × 0.9) − 1 = 23.5%.
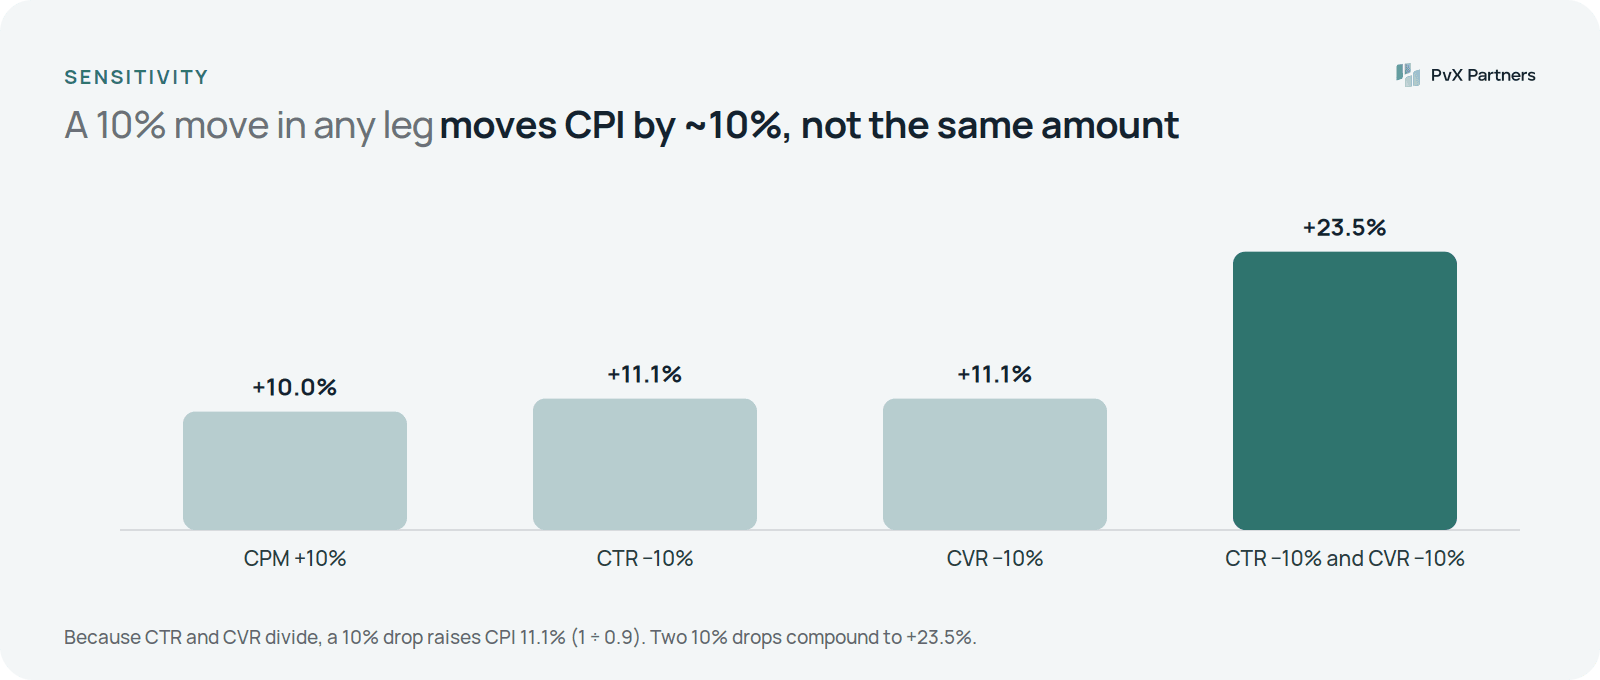
That asymmetry matters in practice. A creative team that lets CTR slip 15% while the store team loses 10% of CVR has raised CPI by 31% — more than either number suggests on its own.
To attribute a CPI change to its legs, compare each leg's ratio (new ÷ old) and use logarithms, because logs turn the multiplication into addition.
ln(CPI ratio) = ln(CPM ratio) − ln(CTR ratio) − ln(CVR ratio)
Each term's share of the total is that leg's share of the move.
Here is the PvX Delta audit spec's sample (a fictional account; illustrative numbers). Aggregate CPI rose from a $3.47 baseline to a $4.10 seven-day average, +18%:
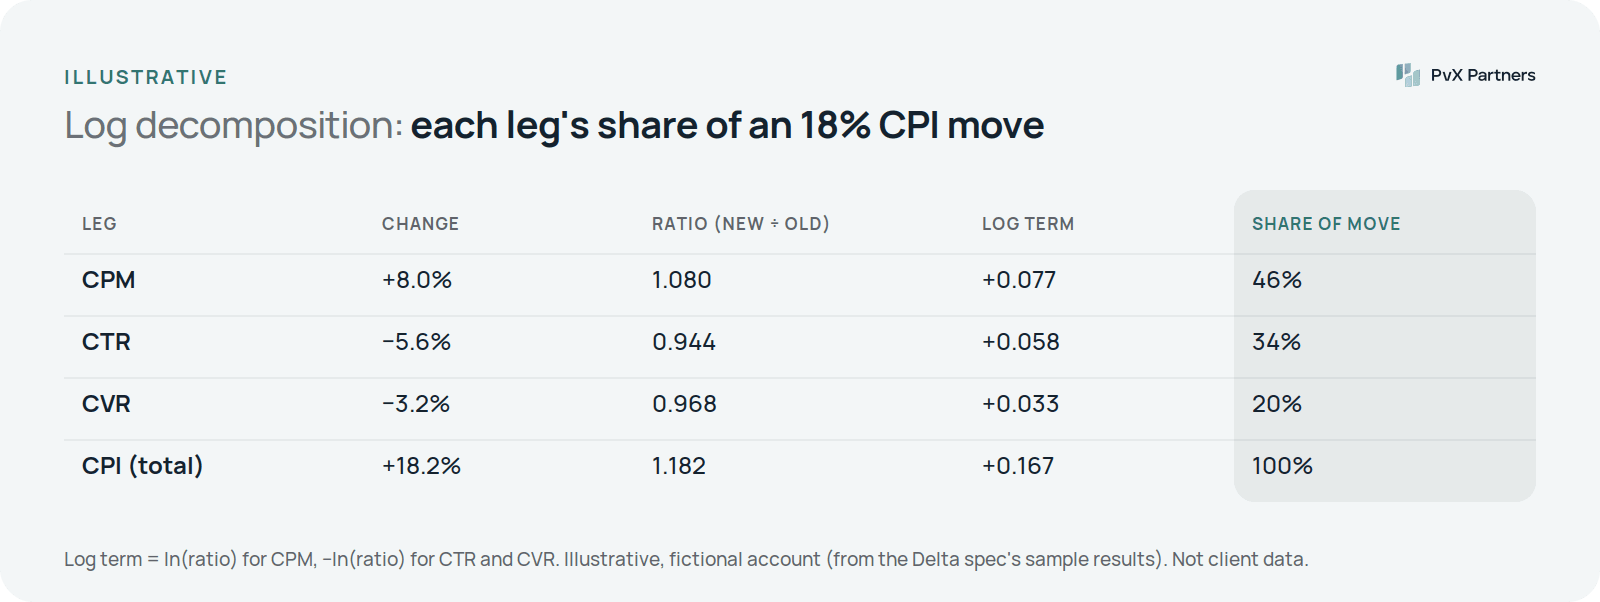
Read across each row: the change becomes a ratio, the ratio becomes a log term, and each log term's share of the total is that leg's share of the move.
Check: 1.080 ÷ (0.944 × 0.968) = 1.182. The legs fully explain the move: CPM accounts for 46% of it, CTR for 34% and CVR for 20%. Nearly half is the price of impressions. That tells you where to look first: auction pressure on a particular network or geo, not the creative.
You can do the same at any depth: OS, country, network, campaign, ad set. The leg that moved, and the slice it moved in, together name the cause. Why is my CPI increasing? walks through that diagnosis end to end.
The formula above holds for any single segment. For an account, CPI is a spend-weighted blend of segments that each have their own CPI. If budget moves from Android to iOS, or from rest-of-world to the US, blended CPI rises even if every segment's CPI is unchanged.
The test: recompute CPI holding each segment's share of installs at its baseline level. If the increase survives, it's a rate change — a real performance move. If it shrinks to nothing, it's mix: an allocation choice, not a problem to fix. In the example above, CPI at fixed weights was still +16%, so most of the move was rate.
PvX Delta is built on this checklist. It runs 100+ deterministic checks from these families across your MMP (AppsFlyer, Adjust or Singular) and your Meta Ads and Google Ads accounts: daily checks every night, weekly checks on their weekly cadence. The validity gate and prioritization run on every pass, and results arrive each morning as a decision brief. There are no prompts to write and no dashboards to build; setup is a data connection. Delta is advisory — it tells you what to change and why, and you make the change. The family-by-family reference is in the PvX Delta check library; how the stages fit together is in how PvX Delta works. If you're comparing approaches, deterministic checks vs anomaly detection covers the trade-off.
Oct 16, 2026 - 15 minutes

Oct 15, 2026 - 15 minutes

Oct 02, 2026 - 15 min
Some of the fastest growing businesses in the industry