
This article highlights key ROAS patterns in our data, from early-month correlations and genre dynamics to CAC, LTV, and channel trends.
Oct 28, 2025 - 5 min read

At PvX Partners, we finance and underwrite UA at scale across hundreds of mobile gaming cohorts each year. This blogpost distills the key ROAS patterns we’re seeing across our dataset: from early-month ROAS correlations and genre dynamics, to macro CAC/LTV trends and channel performance curves.
Whether you’re a UA manager, capital allocator, or founder, these insights provide a clear, data-driven view of how performance and efficiency are evolving.
One of the clearest signals is the relationship between month-1 ROAS (M1) and eventual payback. Across genres, M1 ROAS strongly predicts whether a cohort will reach breakeven at 6 or 12 months.
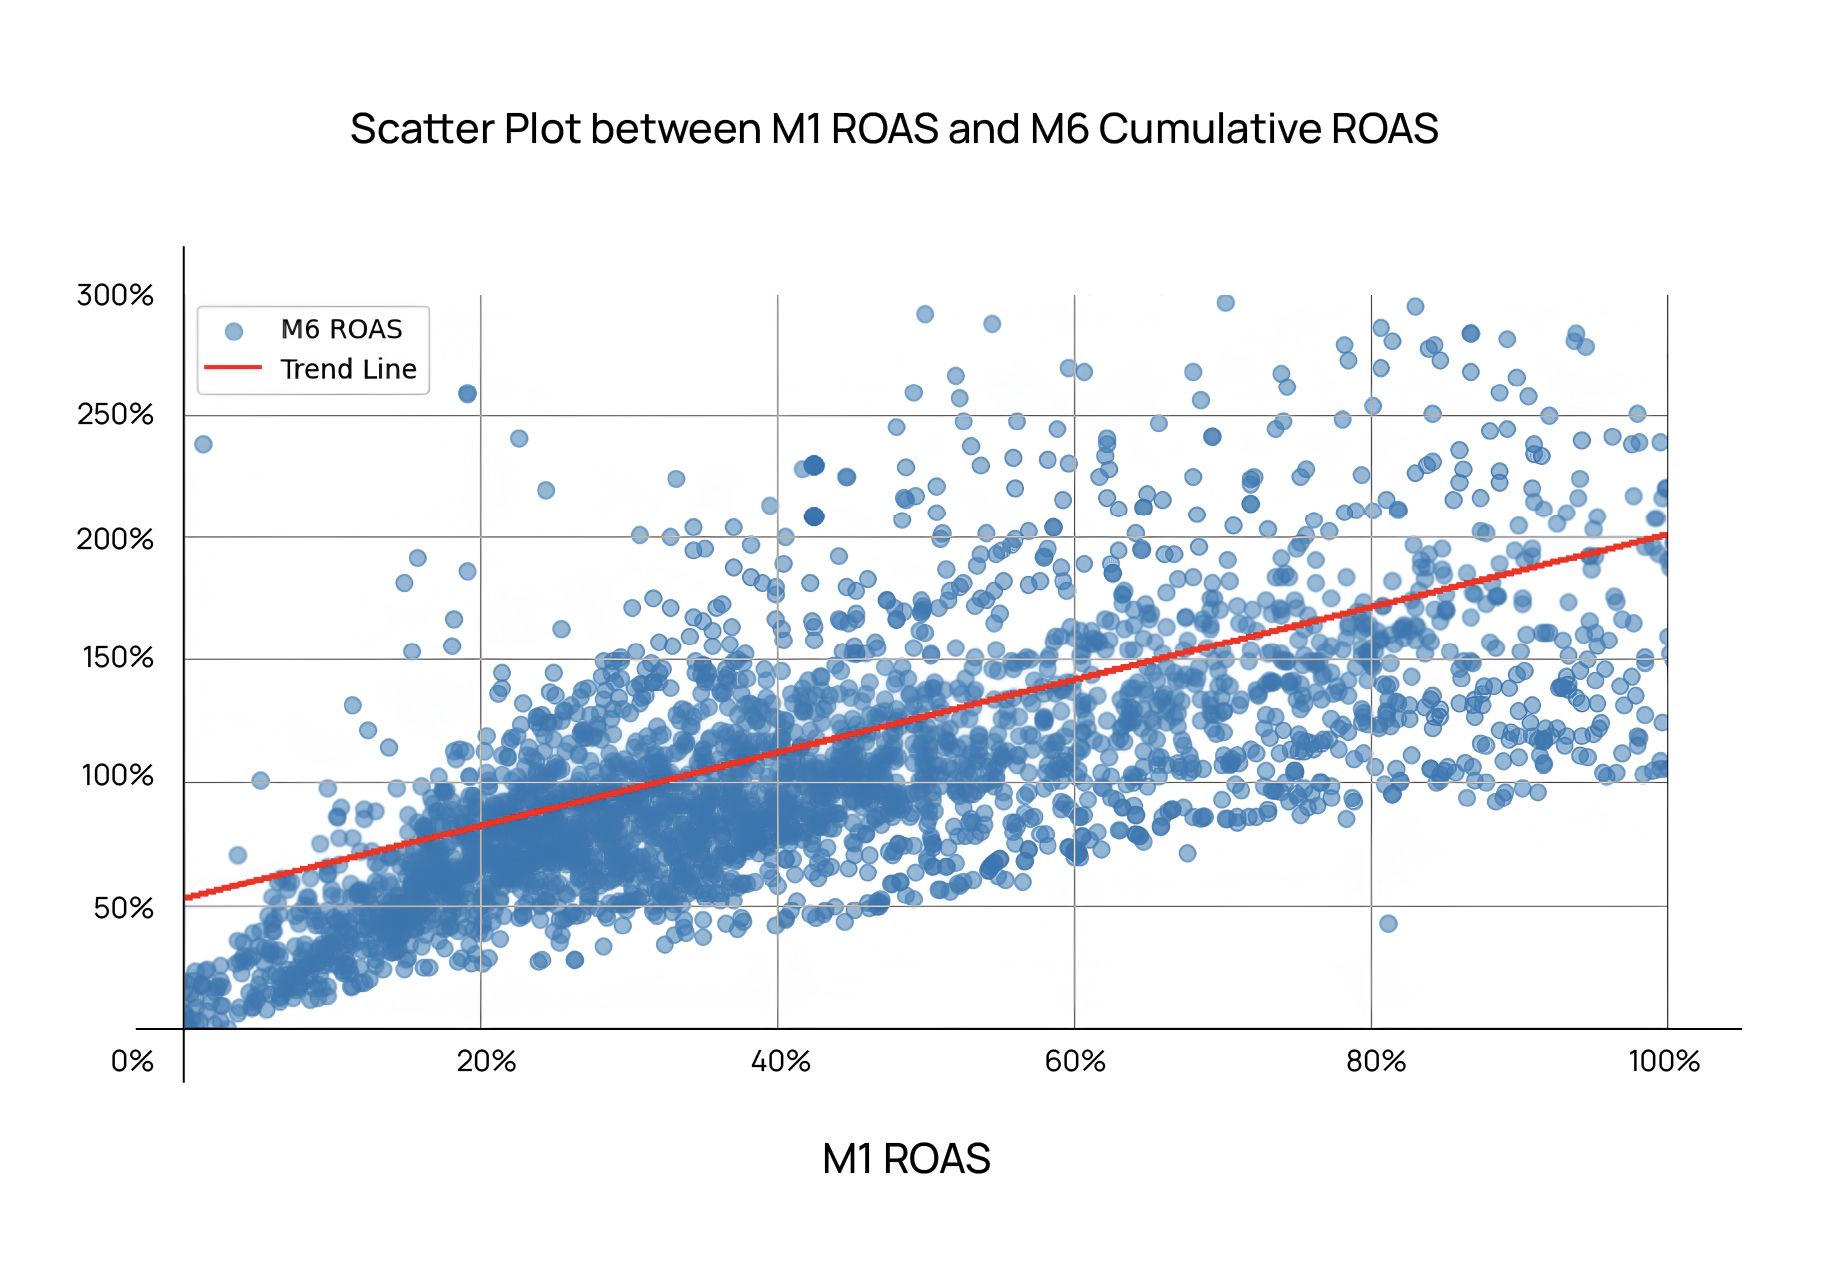
If a cohort isn’t hitting at least 20–32% in the first month, it’s very unlikely to pay back within typical financing windows.
Why this matters varies by genre, but the underlying intuition is consistent:
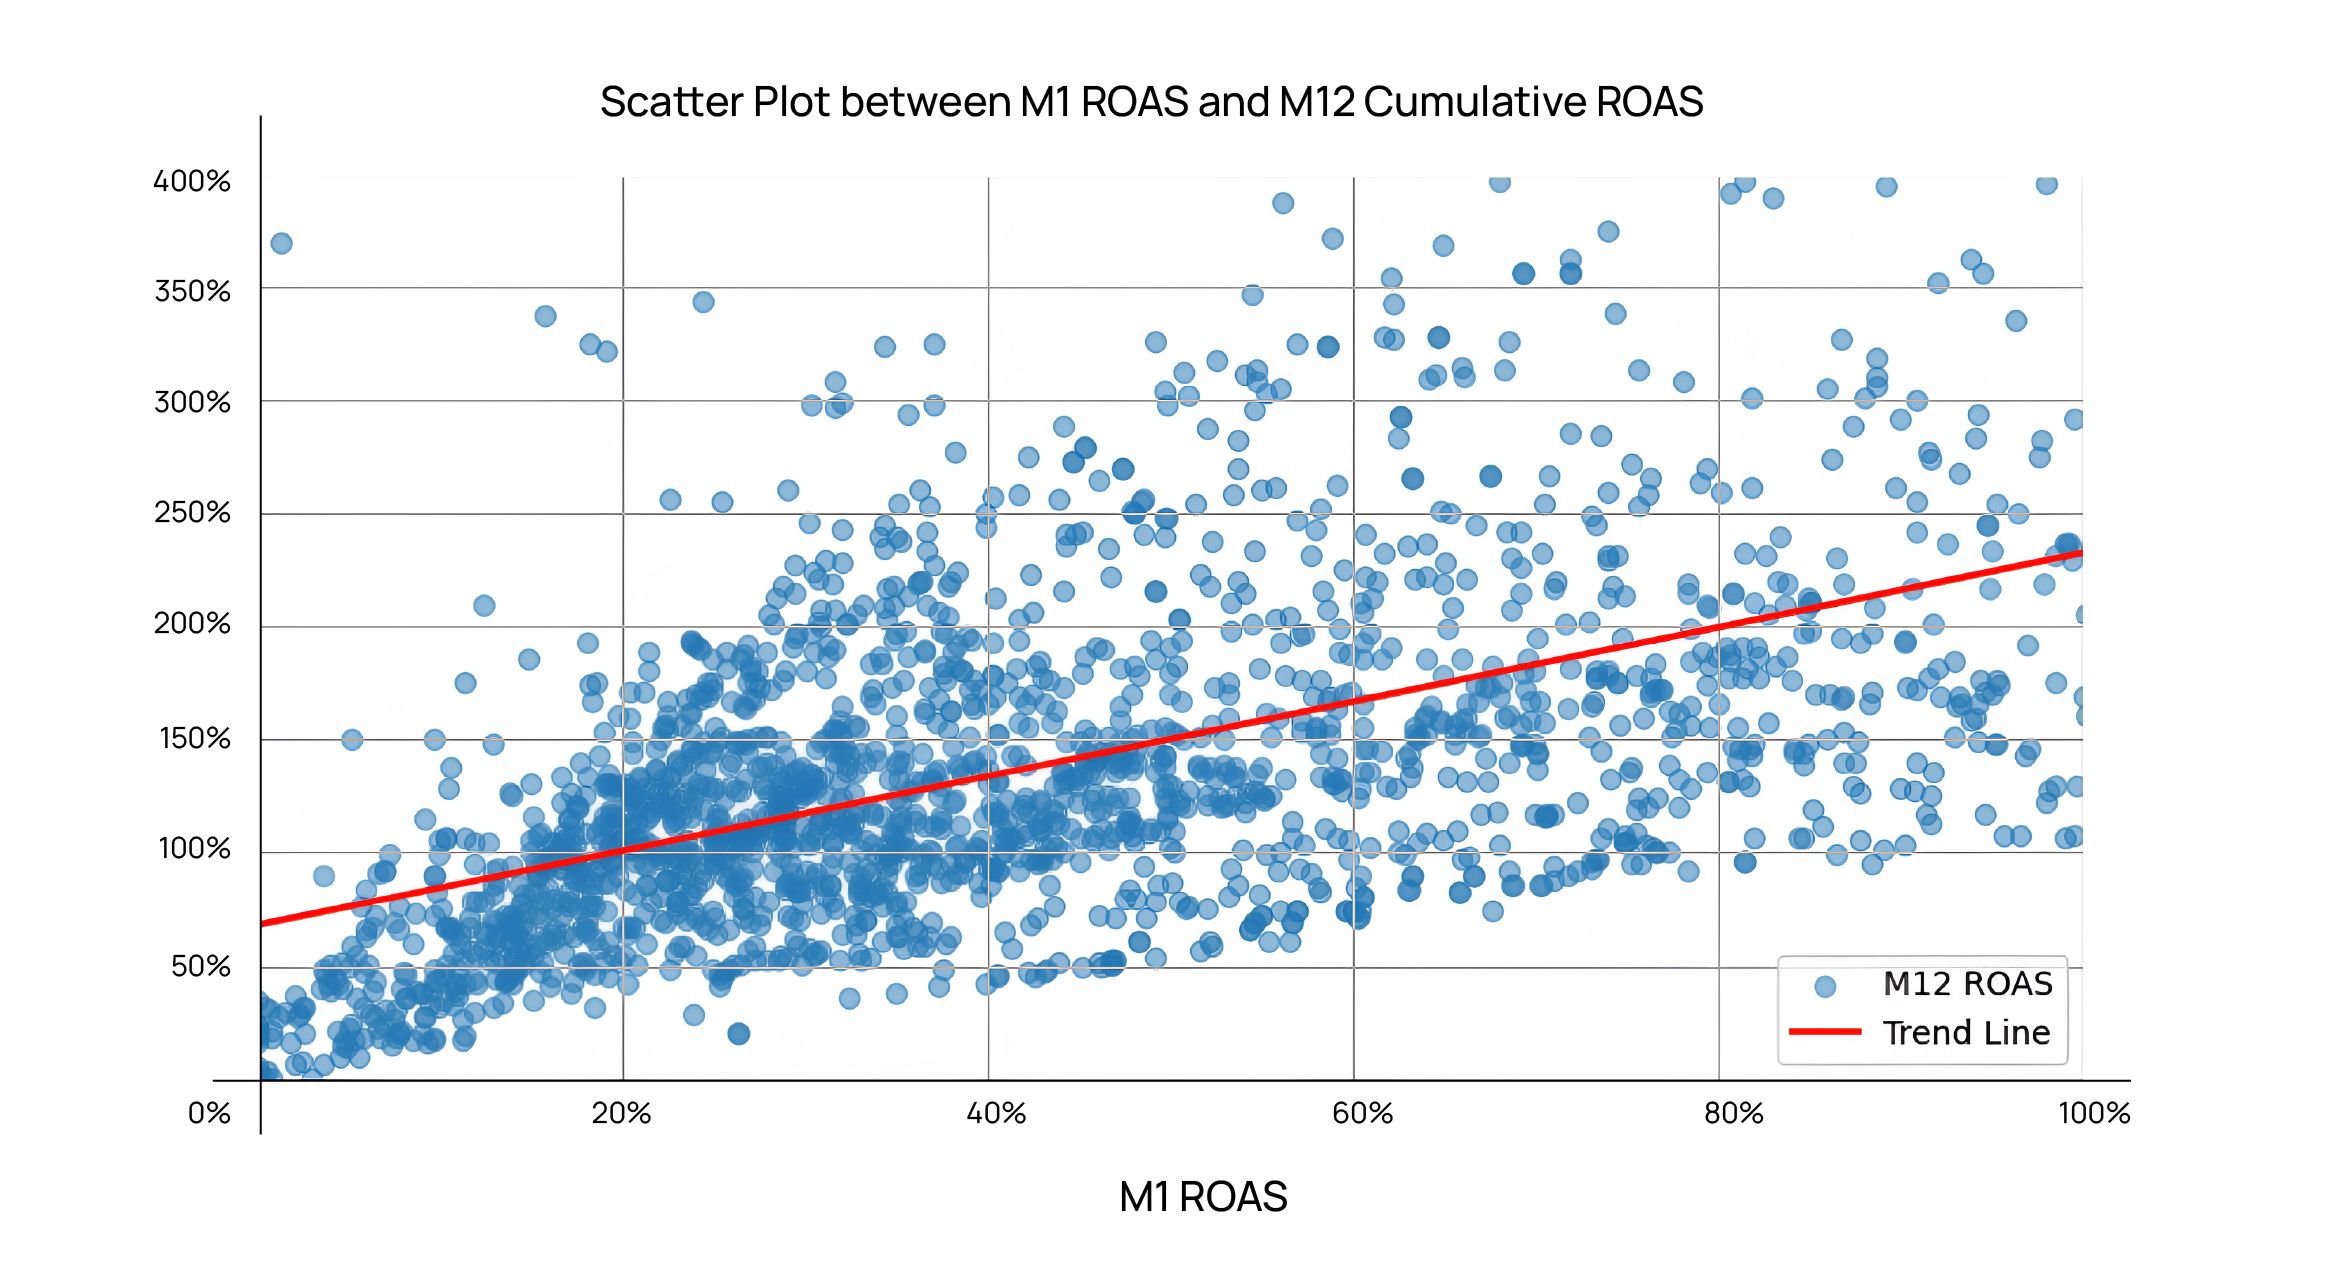
Hitting the right M1 ROAS thresholds is only part of the story. Once a cohort establishes a monetization trajectory, that trajectory tends to persist with very little deviation. In other words, past performance sets the slope - cohorts that start on a strong trajectory usually stay strong, and those that underperform rarely stage late comebacks.
By trajectory, we refer not just to the slope of the ROAS curve, but the overall shape and pace of monetization over time. In practice, this means that once a cohort reaches a certain sequence of ROAS checkpoints in its early months, its eventual 12-month ROAS becomes highly predictable. This varies across different apps/games, but for certain cases, cohorts that achieve 20% ROAS by M1 and 45% by M3 ROAS almost always end up breaking even by M12, while those that miss early checkpoints rarely catch up later.
Across all games and apps in the PvX dataset, the strongest predictors of future ROAS are lag features - metrics derived from prior transaction-period performance. Specifically, we use lagged LTV/CAC ratios from the past 1–3 months (lag-1, lag-2, lag-3) as inputs. These features capture how much incremental monetization a cohort generated in the preceding periods and effectively encode its established momentum.
Because cohorts with strong recent ROAS gains typically maintain that momentum, these lag features exhibit exceptionally high correlation with eventual ROAS and payback. In other words, once a cohort’s monetization curve “locks in,” it tends to follow through on that trajectory unless major product, monetization or retention shifts occur.
While this stickiness is visible across the board, the length and shape of the trajectory differ by genre:
Throughout the past year, we’ve seen a clear divergence between rising customer acquisition costs (CAC) and improving monetization efficiency. PvX’s LTV/CAC and CAC indices across all cohorts illustrate this shift:
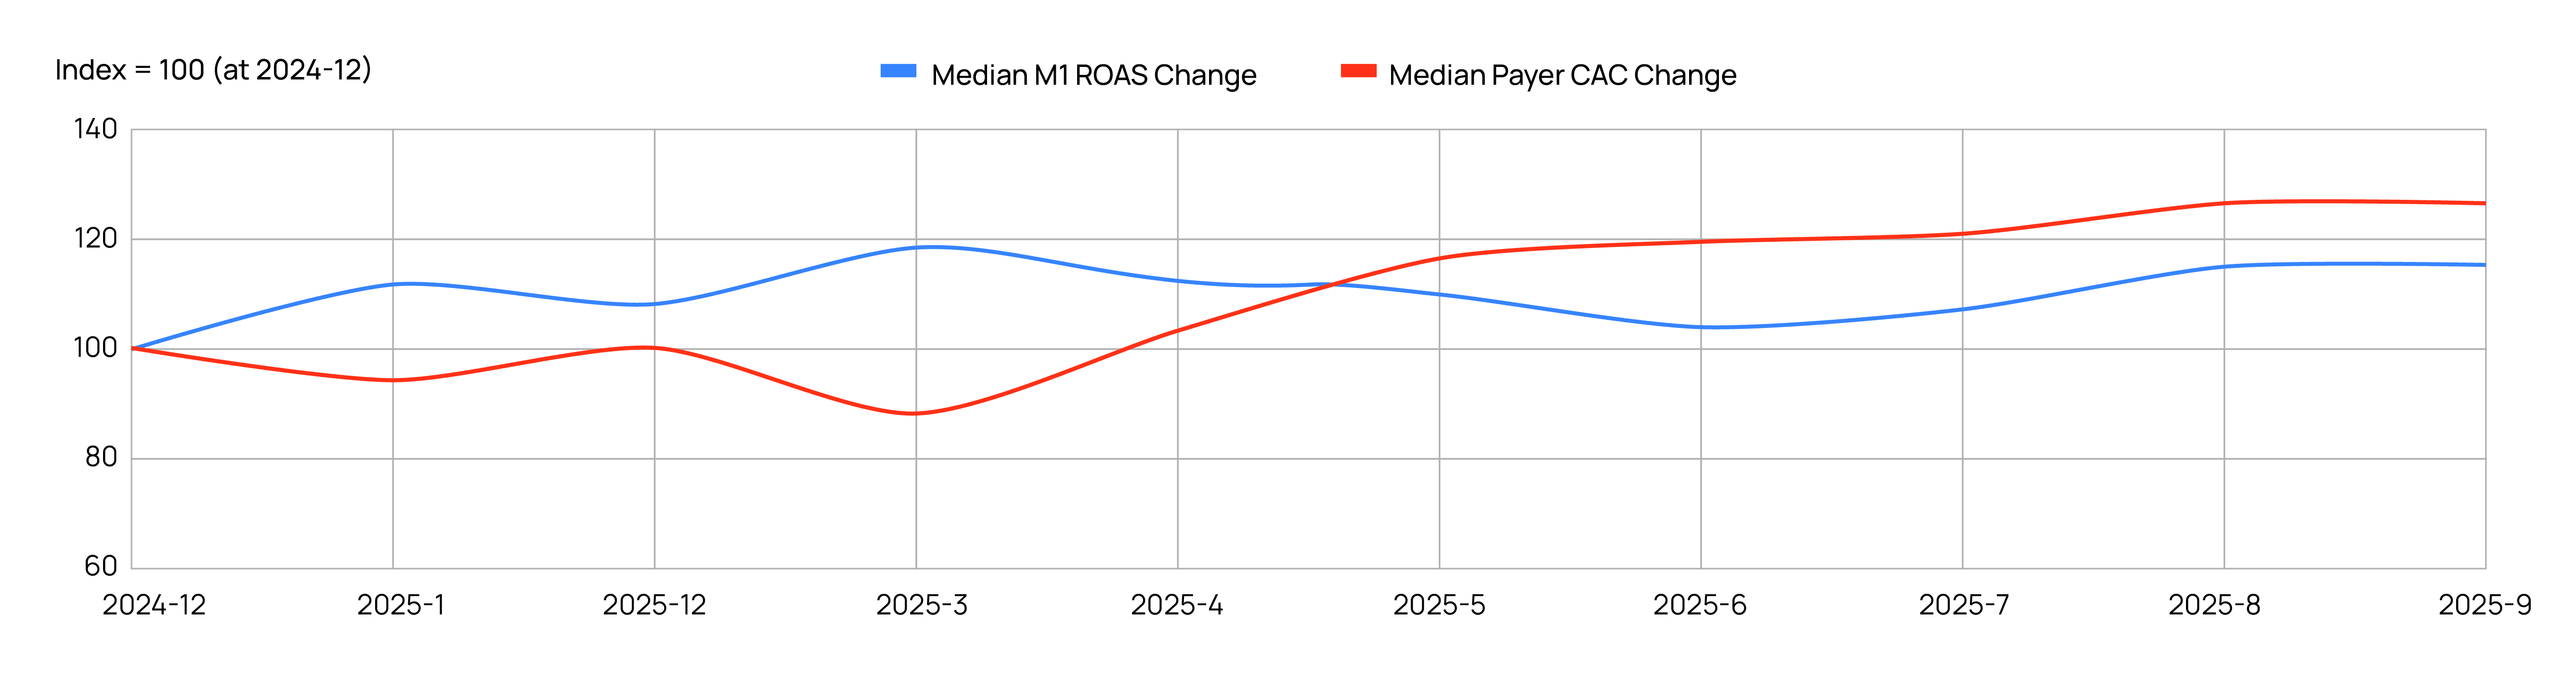
Early in the year, lower CACs combined with better monetization curves to drive a meaningful uplift in efficiency.
From May onwards, CACs steadily increased, yet LTV/CAC remained above prior-year levels. This suggests that monetization has improved enough to absorb rising UA costs, likely through stronger retention, pricing optimizations, and content depth.
By September, CAC was +26 % YoY, but LTV/CAC was still +15 % YoY — a sign that operators have squeezed more revenue out of each user to maintain paybacks despite a more expensive acquisition environment.
However, this equilibrium is fragile. If monetization doesn’t keep improving, continued CAC inflation will start to compress ROAS and lengthen payback periods. The current balance is being propped up by monetization gains, not cheaper traffic.
Across all games, UA spend remains highly concentrated on a few dominant channels:
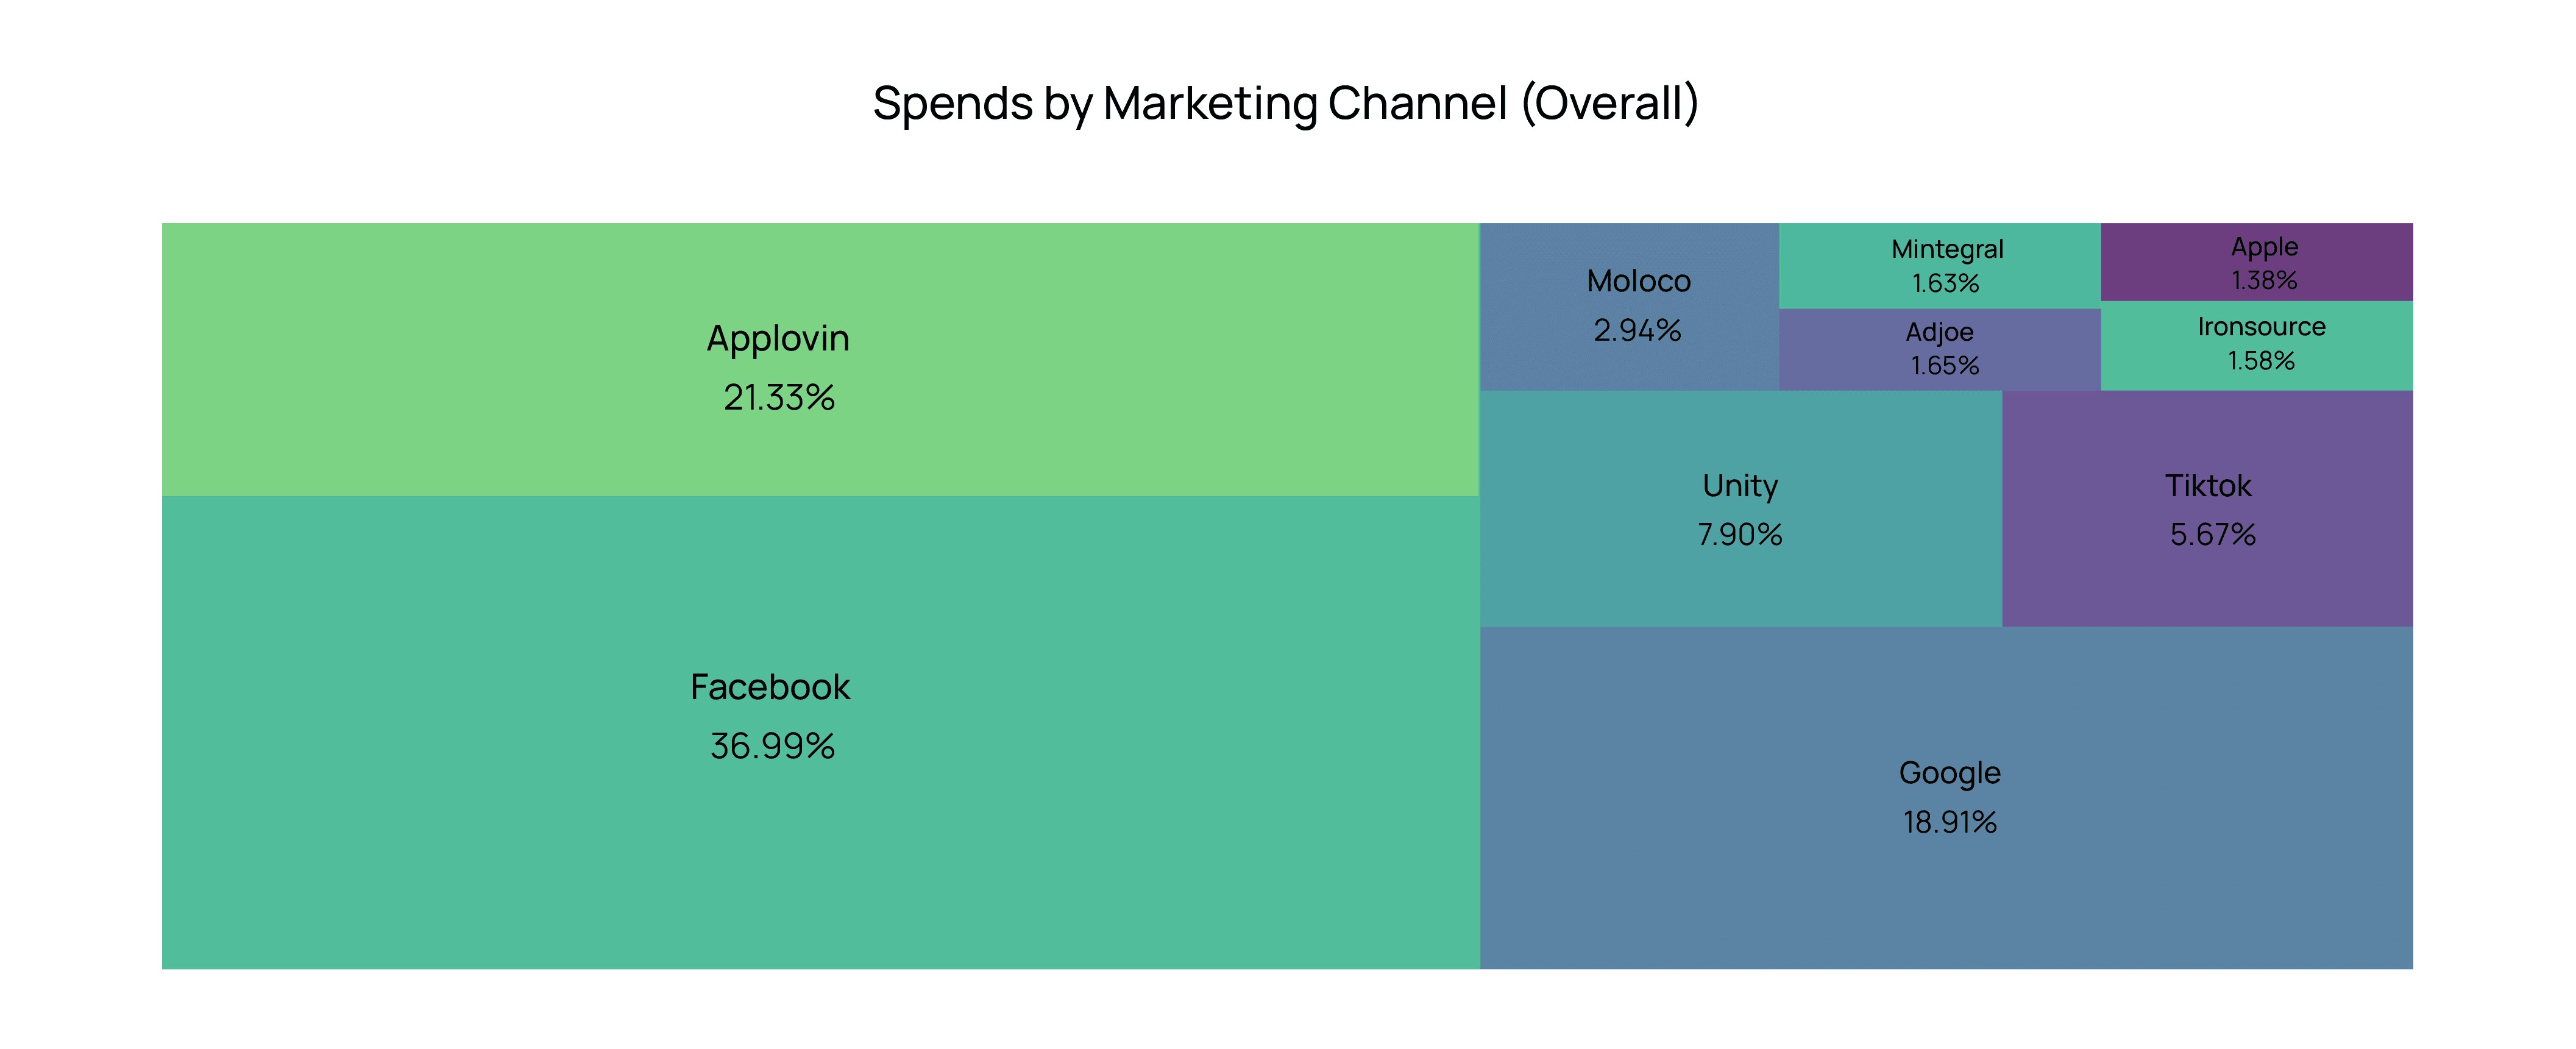
This concentration reflects how most UA strategies are still built around Meta, Applovin, and Google as the primary growth engines, with secondary networks playing tactical or scaling roles.
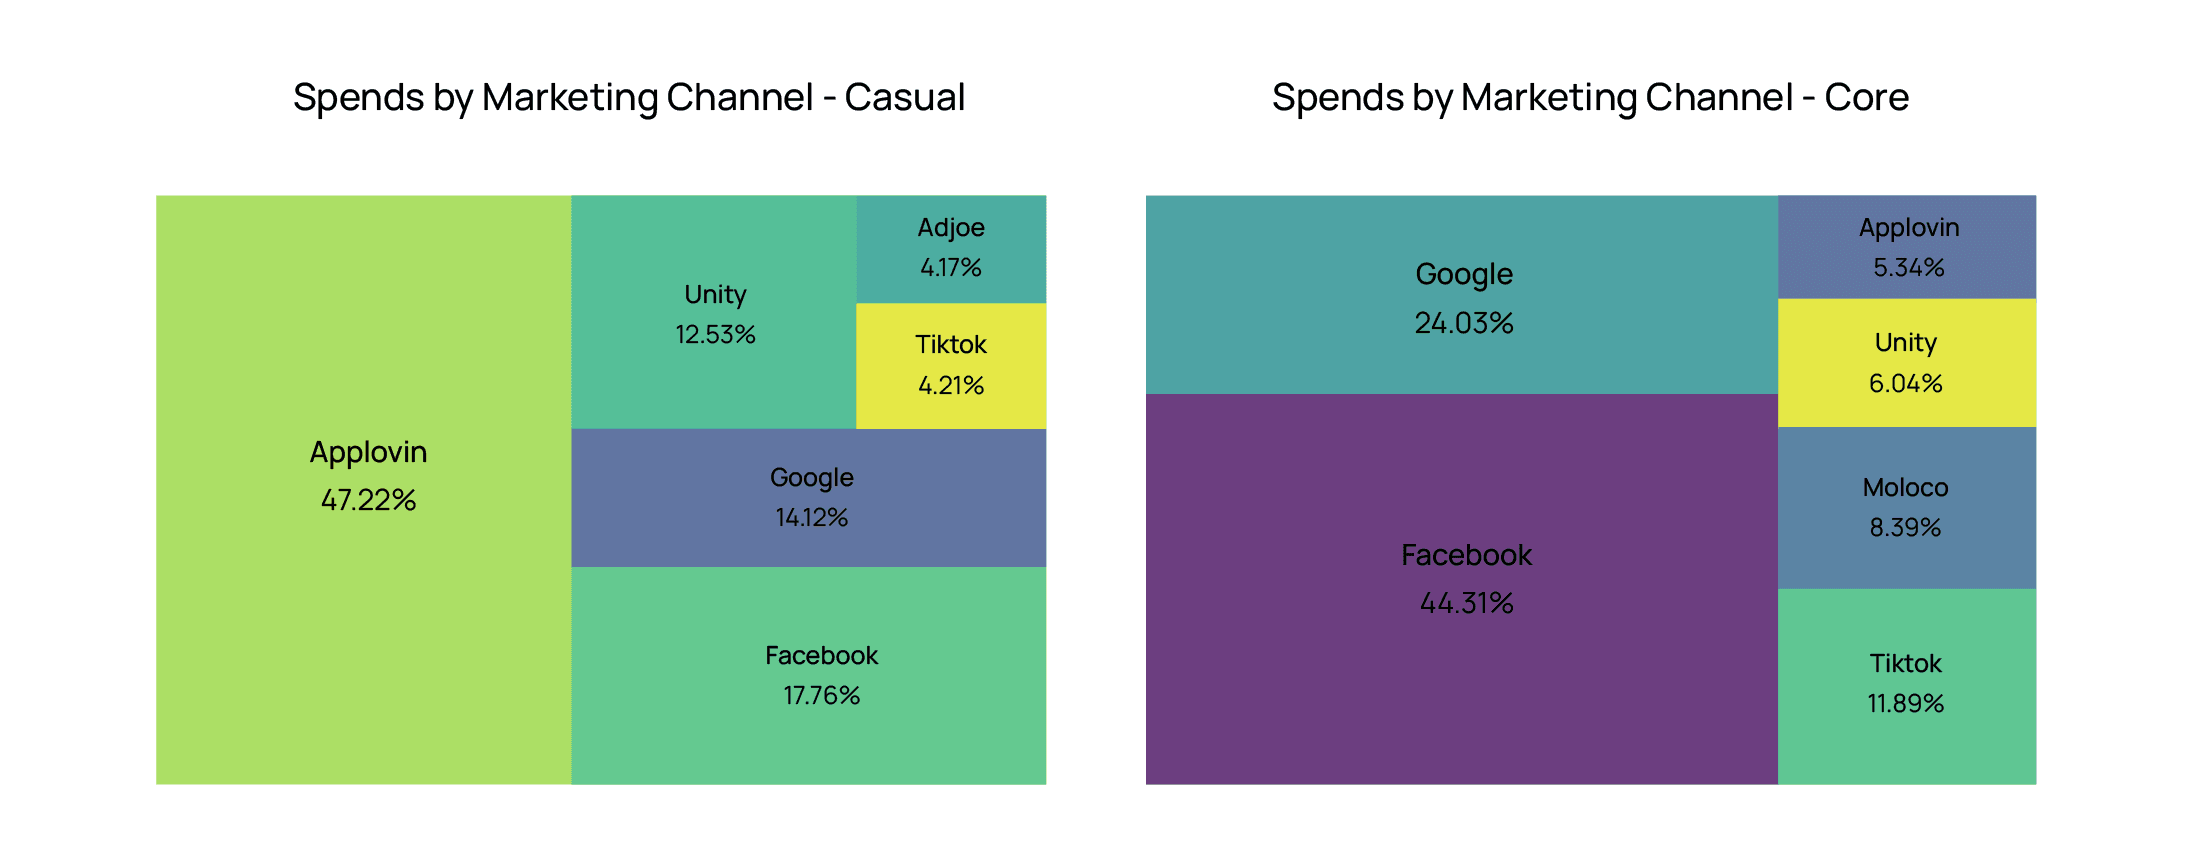
For Casual, Applovin dominates at 47%, followed by Facebook (18%), Google (14%), Unity (12%), TikTok (4 %), and Adjoe (4%). Budgets are clearly top-heavy, focused on a small set of large-scale channels. Casual relies on a narrow set of dominant channels, meaning auction dynamics or creative performance on Meta and Applovin can have outsized effects on paybacks.
For Core, spend is less concentrated. Facebook leads with 44%, followed by Google (24%), TikTok (12%), Moloco (8%), Unity (6%), and Applovin (5%). A broader mix of mid-tier channels is being used, suggesting more diversified UA strategies which can help smooth CAC volatility and support longer monetization arcs.
Looking at cumulative ROAS curves by channel over 12 months reveals a clear story: spend allocation and performance don’t always align, especially for Core titles.
Disclaimer: These curves reflect paid ROAS only and exclude organic uplift. They are best interpreted as channel-specific efficiency trends, not absolute payback figures.
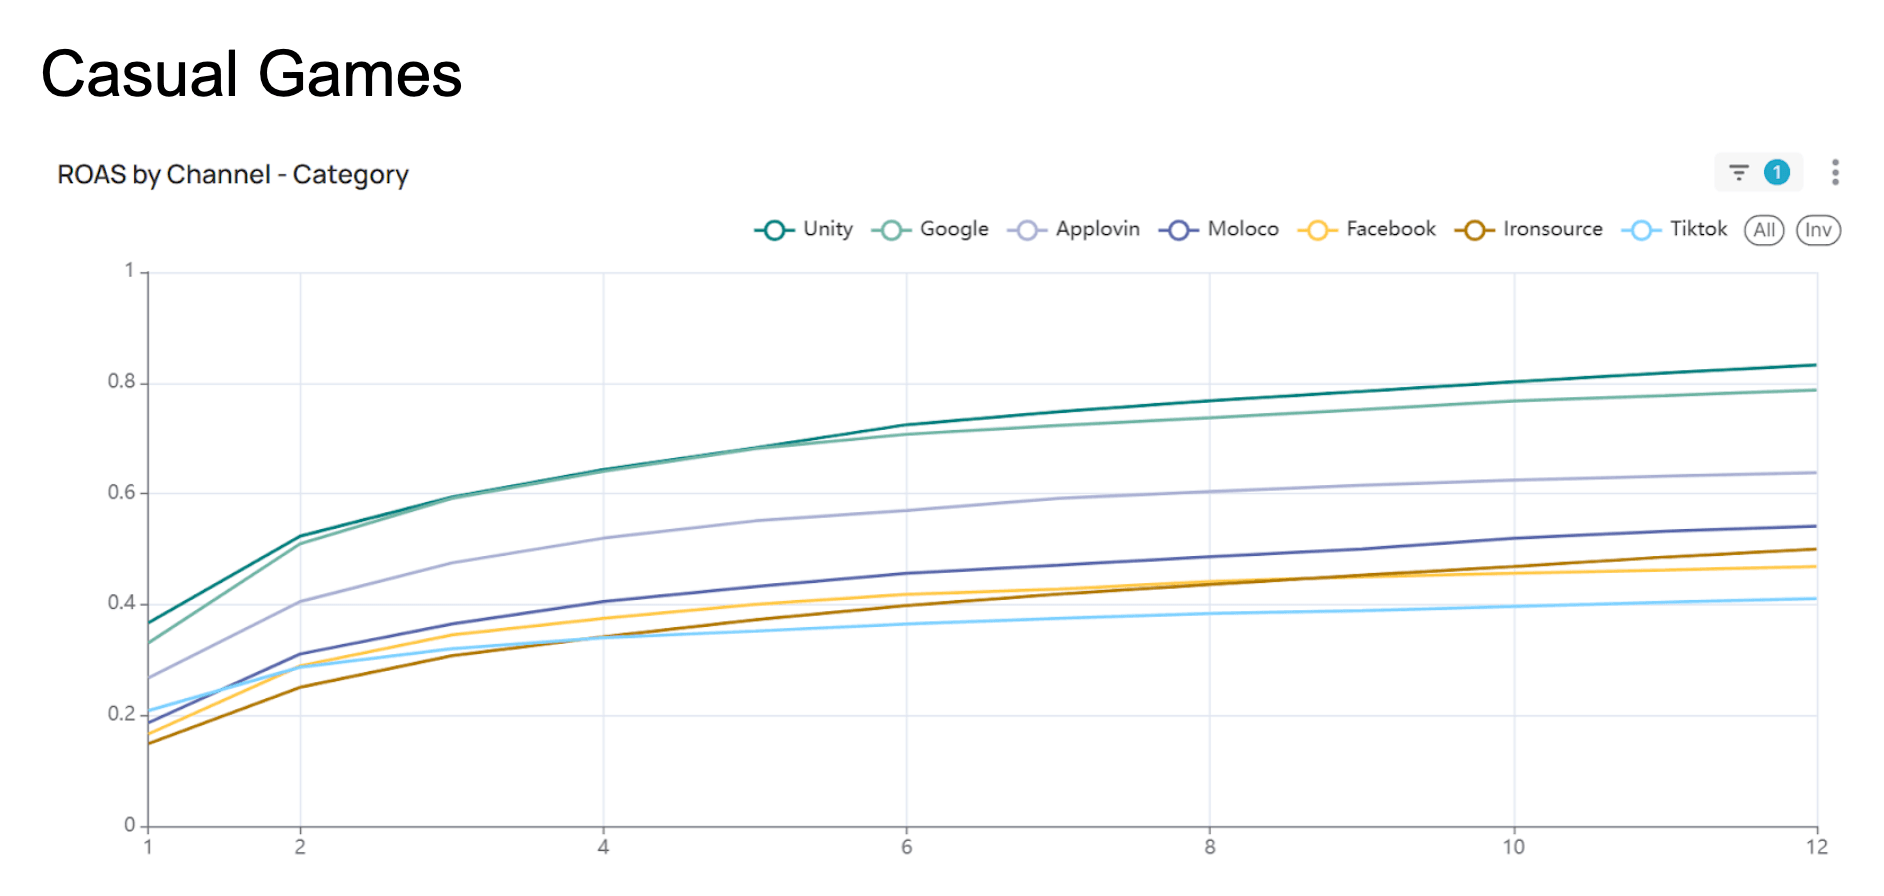
In Casual, Unity and Google emerge as the strongest long-term performers, with curves that continue compounding over time. Applovin and Facebook flatten earlier, indicating less sustained monetization despite their prominence in spend. This creates a spend-performance gap, where a significant share of budgets flows to channels that don’t sustain monetization as effectively, pointing to opportunities for smarter reallocation toward higher-compounding channels.
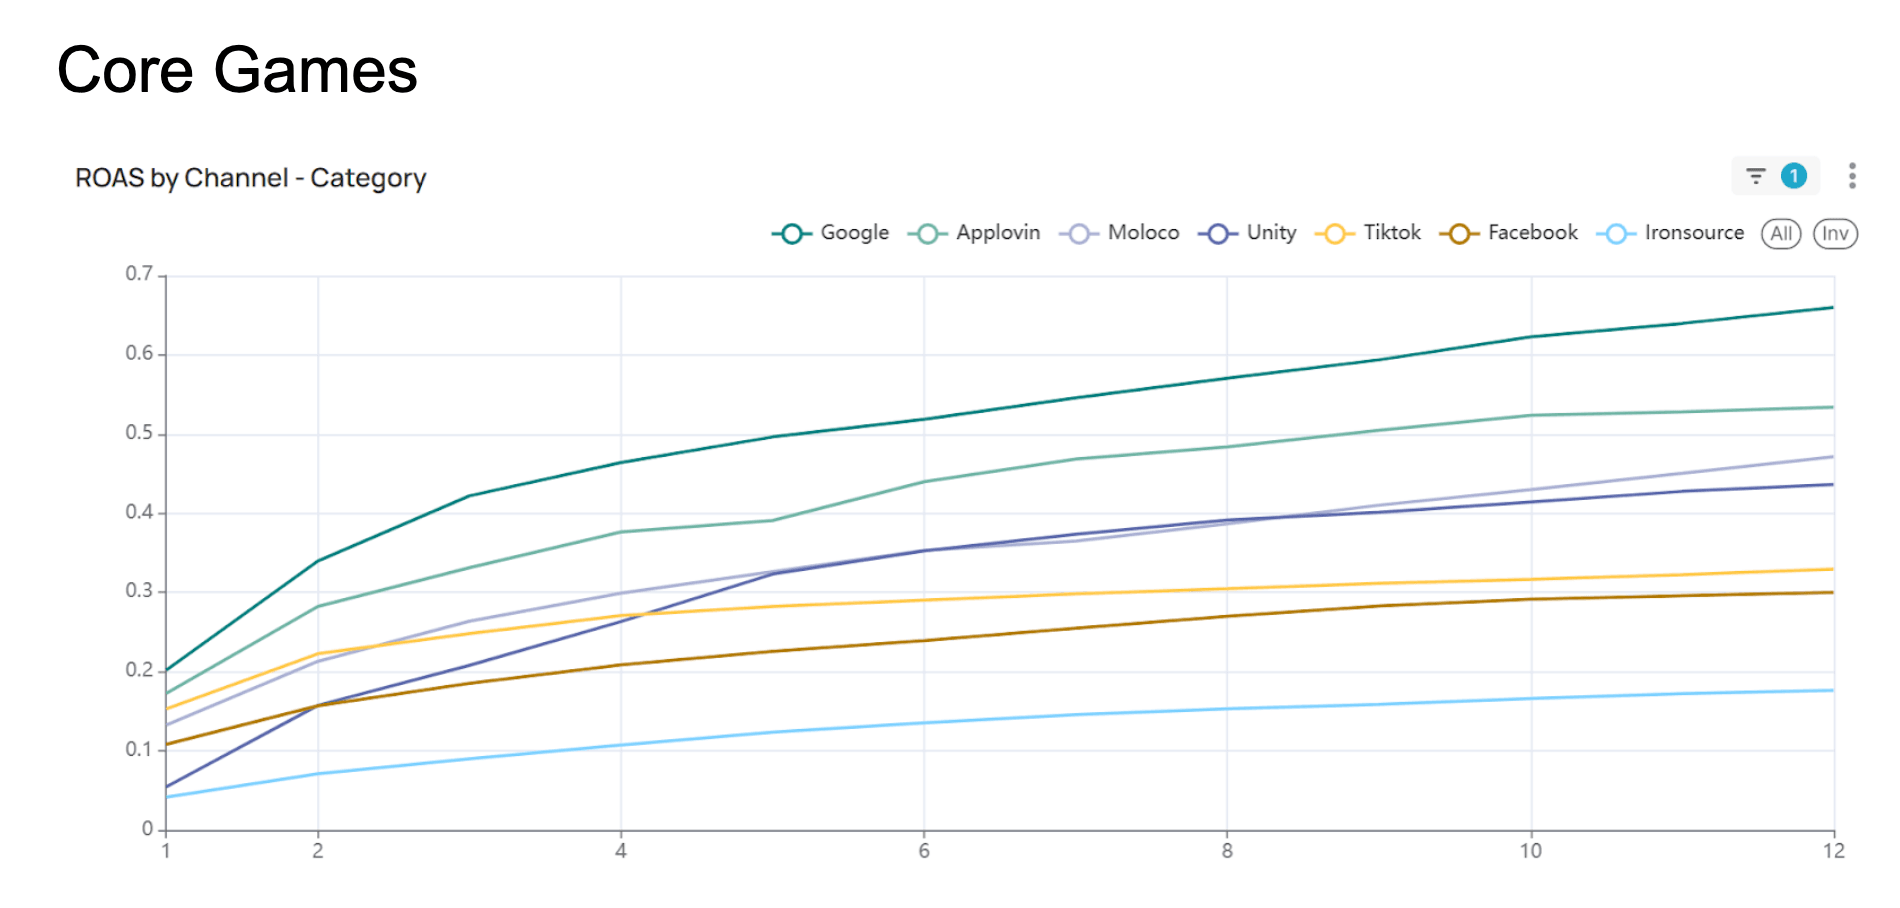
For Core titles, Google and Applovin dominate early performance, rising strongly in the initial months. Unity, TikTok, and other networks form the mid-tier, while Facebook flattens earlier. Here, spend and performance are more closely aligned, but the front-loaded nature of the curves means scale becomes more constrained once top channels mature.
Across genres, early ROAS isn’t just indicative, it’s predictive. Cohorts that start strong tend to stay strong, while weak starts rarely recover. This memory in performance, captured through lag features in our prediction models, reflects persistent player behavior, retention, and UA quality. Strong M1 signals give an early read on long-term monetization, enabling faster, more confident decisions.
Channel strategy amplifies these dynamics. In Casual, payback is often decided within 30 to 60 days, so the challenge is scaling high-performing channels before they plateau. In Core, success depends on allocating budgets across a broader mix and avoiding overspending on flatter curves.
As CACs rise and payback windows lengthen, leveraging early ROAS signals and trajectory persistence gives studios and capital allocators a sharper lens for capital deployment - identifying the right campaigns/channels/strategies to back and optimizing spend for durable, efficient growth.
At PvX, we finance UA with speed and precision, leveraging these analytical insights to underwrite campaigns intelligently. Our approach delivers capital exactly when it’s needed, while maintaining discipline around paybacks and efficiency. Whether funding early growth or scaling established titles, PvX brings both capital and insight - enabling partners to grow faster and smarter.

Jun 05, 2026 - 2 min read
May 28, 2026 - 5 min read

May 15, 2026 - 4 min read
Some of the fastest growing businesses in the industry